



About these figures
The project observations below describe selected engagements and the reporting period stated in the methodology. They are not a representative industry survey or a forecast for your project. Client-level source records are not published with this article.
TL;DR
- The AI-scaled cohort lost the most, by a wide margin. Pages generated at volume with no dataset underneath survived the update at 12% and lost a median 64% of organic clicks within eight weeks. Two in five were dropped from the index entirely, not just demoted.
- The real-data cohort gained through the update. Server-rendered pages backed by live or licensed data survived at 81% and finished the window with a median 11% more clicks than their pre-update baseline, because the sludge they had been competing against was removed from the results.
- Data uniqueness predicted survival better than domain authority. Pages scoring above 80 on our Data Uniqueness Score survived at 90% regardless of domain strength. Pages under 20 on DR 70+ domains survived at 14%. The same score also predicted which pages AI Overviews cite.
The March 2026 core update was the one the programmatic SEO industry had been bracing for since the scaled content abuse policies landed. Google spent roughly three weeks rolling it out, and the coverage since, including Digital Applied's post-update analysis, has described it as a purge of scaled thin content. That framing is broadly right, but it is a description of the losers. What has been missing is a measured account of the survivors: which programmatic pages came through the update intact, which gained, and what separated them from the pages that vanished.
We were in an unusual position to answer that. We build programmatic SEO surfaces for clients, which means we had page-level Search Console instrumentation running on programmatic templates long before the update was announced. We also inherit programmatic surfaces we did not build, usually the scaled, thin kind, when clients bring us in to rescue them. That mix gave us a natural panel: 1,842 programmatic pages across 14 client properties, spanning the full quality range from machine-spun sludge to server-rendered pages backed by live data.
We split the panel into three cohorts by data uniqueness, froze the assignments before the update began rolling out, and tracked every page through to the end of June. From the raw panel we computed three metrics used throughout this report: Update Survival Rate (USR), Data Uniqueness Score (DUS), and AI Citation Rate (AICR). The intent is the same as our other panel studies: not to declare programmatic SEO alive or dead, but to put measured numbers on what Google actually rewarded and punished, and to test the thesis we have been running client engagements on for two years.
Methodology and data sources
The panel design:
- Pages: 1,842 programmatic URLs across 14 client properties (SaaS and marketplace sites). A page qualified as programmatic if it was generated from a template over a structured set of variants: location pairs, comparisons, calculators, integration pages, pricing variants.
- Cohorts, assigned before the update: real-data programmatic (622 pages), server-rendered with a live, licensed, or internally computed dataset and unique figures per URL; template-thin (531 pages), human-written or human-edited templates with correct but interchangeable copy and little unique data; AI-scaled (689 pages), machine-generated at volume with no dataset underneath, almost all inherited from properties before our engagement began. Some properties contributed pages to more than one cohort.
- Baseline window: nine weeks pre-update (5 January to 8 March 2026), weekly clicks and impressions per URL from Search Console.
- Update window: the rollout ran from 10 March to 2 April 2026. We measured survival at day 60 after rollout completion and continued tracking to 30 June.
- Instruments: Search Console URL-level exports for clicks, impressions, position, and index coverage; GA4 for sessions and conversions on the surviving pages; Ahrefs for domain metrics and AI Overview presence on a tracked panel of 3,140 queries mapped to the panel pages.
Cohort assignment was done by a single reviewer using the DUS rubric described later, on a random 60-page calibration sample first, then the full panel, to keep scoring consistent. All 14 property owners consented to anonymised inclusion. No client identifiers appear in the data; everything below is aggregated to cohort level.
Finding 1: The AI-scaled cohort lost 64% of its clicks in eight weeks
Chart 1: Update Survival Rate and click delta by cohort, day 60
A page survives if it holds at least 80% of baseline weekly clicks at day 60 after rollout completion. Click delta is the cohort median vs the 9-week pre-update baseline.
| Cohort | Pages (n) | USR at day 60 | Median click delta | Dropped from index |
|---|---|---|---|---|
| Real-data programmatic | 622 | 81% | +11% | 2% |
| Template-thin | 531 | 47% | -22% | 9% |
| AI-scaled | 689 | 12% | -64% | 41% |
Sources: Google Search Console exports across 14 client properties (January to June 2026); GA4; Ahrefs Site Explorer and AI Overview tracking (https://ahrefs.com/). Cohorts assigned before the update; figures rounded.
The headline result is the gap between the extremes. The AI-scaled cohort did not decline, it collapsed: a median 64% of clicks gone by day 60, and 41% of the pages removed from the index entirely, showing up in Search Console as "Crawled, currently not indexed". That last number matters because deindexation and demotion are different fates. A demoted page can recover with improvement. A deindexed page has been judged not worth storing, and in our 12-month indexing decay panel we measured how rarely pages come back from that state without substantive change: the decay is a one-way door unless the content itself changes.
The mechanism was visible in the query data. AI-scaled pages had been ranking almost exclusively on very long-tail queries with weak competition. The update did not reweight them downward so much as remove them from consideration: impressions fell faster than average position moved, which is the signature of pages being filtered out of candidate sets rather than outranked. By contrast, the template-thin cohort showed classic demotion: positions slid two to six spots, impressions held, clicks bled. Thin-but-honest content was reweighted. Scaled content was removed.
Finding 2: Real-data pages gained through the update
Chart 2: Survival curves, share of pages holding 80%+ of baseline clicks
Weekly share of each cohort still at or above 80% of pre-update baseline clicks, from rollout completion (week 0) to week 12.
| Weeks after rollout | Real-data | Template-thin | AI-scaled |
|---|---|---|---|
| 0 | 100% | 100% | 100% |
| 2 | 97% | 88% | 63% |
| 4 | 93% | 71% | 34% |
| 6 | 89% | 60% | 21% |
| 8 | 84% | 52% | 15% |
| 12 | 81% | 47% | 12% |
Sources: Google Search Console exports across 14 client properties (January to June 2026); GA4; Ahrefs Site Explorer and AI Overview tracking (https://ahrefs.com/). Cohorts assigned before the update; figures rounded.
The survival curves separate immediately and never converge. The AI-scaled cohort lost a third of its surviving pages in the first two weeks, while the update was still rolling out. The template-thin curve declines more gently and keeps declining after the rollout ended, which suggests the reweighting continued to propagate as pages were recrawled. The real-data curve flattens after week 8 at 81%, and the pages that fell out of it mostly did so for reasons we could identify: two templates with stale data (more on that in the limitations), and one property with an unrelated migration mid-window.
The more interesting number is the sign on the real-data click delta: positive 11% at the median, with the upper quartile at +34%. These pages did not merely survive the update, they benefited from it. The query-level data shows why. On long-tail queries where a real-data page had been sharing the results with three or four scaled pages, the scaled pages disappeared and the clicks re-consolidated onto what remained. A core update that removes your worst competitors is, mechanically, a ranking improvement for you, and programmatic surfaces live almost entirely on long-tail queries where scaled content had been thickest.
This is also the empirical shape of the yield curve we describe on our programmatic SEO engineering service page and have repeated to every client who asked why their surface looked flat in month two: real-data programmatic compounds slowly, over roughly 90 to 180 days while Google crawls and indexes at volume, and then keeps climbing. Several of the panel's real-data templates launched in late 2025 were still inside that indexing window when the update hit. They came through it not only unharmed but accelerated.
Finding 3: Data uniqueness predicted survival better than domain authority
Cohort membership is a blunt instrument, so we also scored every page individually. The Data Uniqueness Score asks a simple question: if you change the entity the page is about, how much of the page changes with it?
DUS = 100 x (variant-specific content units / total content units per page)
A content unit is a fact, figure, table row, FAQ answer, or paragraph claim. On a shipping calculator page, the rates, the customs note, the example calculation, and the country-specific FAQ are variant-specific units. The boilerplate explainer that appears on all 300 variants is not. A pure slot-fill template, where only the city name and a handful of adjectives change between URLs, scores under 10. A page where the data is the page scores above 80.
Chart 3: Update Survival Rate by DUS band
All 1,842 pages pooled across cohorts, banded by pre-update Data Uniqueness Score.
| DUS band | Pages (n) | USR at day 60 |
|---|---|---|
| 0 to 20 | 574 | 9% |
| 21 to 40 | 402 | 31% |
| 41 to 60 | 346 | 58% |
| 61 to 80 | 287 | 77% |
| 81 to 100 | 233 | 90% |
Sources: Google Search Console exports across 14 client properties (January to June 2026); GA4; Ahrefs Site Explorer and AI Overview tracking (https://ahrefs.com/). Cohorts assigned before the update; figures rounded.
The gradient is monotonic and steep: each 20-point band roughly doubles or better the survival odds of the band below it. The result that surprised us is what DUS did to domain authority as a predictor. The comfortable assumption in the industry has been that strong domains can carry weak pages. In this update they could not: pages scoring under 20 on DUS that sat on DR 70+ domains survived at 14%, barely better than the band average. Meanwhile pages scoring over 60 on domains with DR under 40 survived at 71%. Whatever the update's classifiers were measuring, they were measuring it at the page and template level, and the domain was not an alibi.
For anyone triaging their own surface, this is the practical takeaway: score your templates, not your domain. A template is a shared fate. In our panel, templates lived or died as units, with within-template survival highly correlated, which is also why Search Console analysis by template group, the way we described in the JavaScript SEO study of 103 funded SaaS sites, is the only workable way to audit a surface with hundreds of URLs.
Finding 4: What the survivors had in common
We coded every surviving real-data page against a checklist of structural attributes. Four showed up in more than 85% of survivors and in fewer than a third of the casualties:
- Server-rendered content on first byte. The rates, figures, and answers were in the HTML the crawler received, not injected after hydration. Every casualty cohort was heavier on client-rendered content.
- A meaningful default state. Interactive pages (calculators, comparison tools) rendered a realistic worked example server-side rather than an empty form.
- Structured data that matches the page. Describe products, services and navigation accurately. Our SaaS structured-data guide explains current feature support and measurement. Schema presence alone does not establish a ranking or AI citation benefit; Google retired FAQ rich results in May 2026.
- Internal links from indexed pages. Survivors averaged five internal links from other indexed pages; casualties averaged under two, many of them orphans reachable only from an XML sitemap.
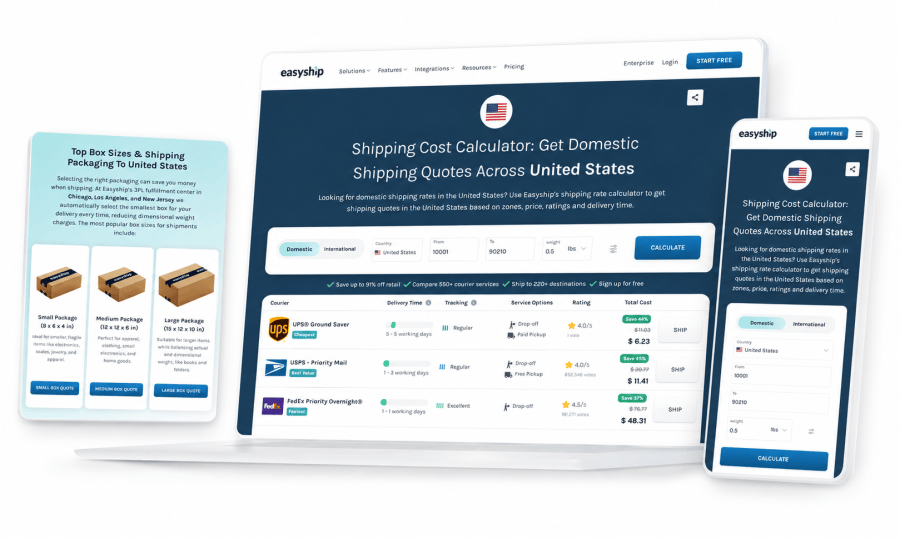
The canonical example of all four attributes at once is the surface we built for Easyship, a shipping SaaS now valued over $40M, with 550+ courier integrations behind it. Their programmatic engine is 100+ shipping rate calculator pages, where every origin-destination pair (USA to USA, HK to USA, SG to USA, AU to USA, hundreds more) is a separately indexable landing page, server-rendered with live rate data and country-specific FAQ content. Each page captures a long-tail "shipping from X to Y" query, which is about the highest-intent traffic a shipping SaaS can attract.
The part that made those pages update-proof is the pattern we now call the calculator SSR default state. A calculator is fundamentally interactive: the user picks options and the result computes client-side. Rendered naively, the crawler sees an empty form and the page looks thin. The fix is to ship a meaningful default state in the static HTML: realistic parcel values, real rates for that specific pair, an example calculation written out in prose, and schema for the service being offered. The interactive calculator then layers on top once JavaScript runs. Crawlers get a full, unique, data-rich page; users get a working tool. In skeleton form:
// app/shipping/[origin]/[destination]/page.tsx
export async function generateStaticParams() {
  return PAIRS.map(({ origin, destination }) => ({ origin, destination }));
}

export default async function Page({ params }) {
  const { origin, destination } = await params;

  // Default state computed on the server: a realistic parcel,
  // live rates for this exact pair, ranked by price and speed.
  const rates = await getRates(origin, destination, DEFAULT_PARCEL);

  return (
    <>
      <RateTable rates={rates} />            {/* real figures in the HTML */}
      <WorkedExample rates={rates} />        {/* prose: "a 2kg parcel from X to Y costs..." */}
      <PairFaq origin={origin} destination={destination} />
      <JsonLd data={serviceSchema(origin, destination, rates)} />
      <InteractiveCalculator initial={rates} /> {/* hydrates on top of the default state */}
    </>
  );
}
Notice what this pattern does to DUS. The rate table, the worked example, and the FAQ all change when the pair changes, because UK customs genuinely differs from US customs and the "you save" delta is computed from real courier data. The page is not a template wearing a country name; it is the same engine wearing different country pairs, with the data doing the differentiating. That is the line the March update drew, and the rendering mechanics that put those figures into the first HTML response are exactly the trade-offs we measured in our Next.js App Router SSR-for-SEO breakdown.
The three strategies, revisited
For two years our programmatic SEO service page has carried a three-way frame we use to qualify engagements, and the March update was the closest thing to a controlled test of it we will ever get:
- AI sludge dies. Thin, machine-spun pages with no real data behind them spike early on volume, then get penalised and collapse. Nothing compounds because there was never anything underneath. The panel version: USR 12%, median clicks down 64%, 41% deindexed.
- Human-written thin plateaus. Hand-written but shallow pages survive the penalty filter but never capture the long tail, because each page says roughly the same thing. The panel version: USR 47%, median clicks down 22%, position demotion rather than removal.
- Real-data programmatic compounds. Slow at first while Google crawls and indexes at volume, roughly 90 to 180 days, then it keeps climbing. The panel version: USR 81%, median clicks up 11%, gains concentrated exactly where scaled competitors vanished.
Before March we would have described this frame as a thesis with strong anecdotal support. The update converted it into something closer to a measured law of the category. The middle path is the one worth dwelling on, because it is where most honest teams sit. Template-thin content is not spam and Google did not treat it as spam. But a 47% survival rate is a coin flip, and a business surface built on a coin flip is not an asset. The uncomfortable conclusion from the panel is that there is no stable middle: either the dataset carries the page, or the page is living on borrowed relevance.
The AI Overviews layer: surviving Google is no longer the whole game
Everything above measures blue-link clicks, and blue-link clicks are themselves a shrinking resource. By the time the March update rolled out, AI Overviews were appearing on roughly 48% of the queries in our tracked panel, consistent with Seer Interactive's tracking, which also measured organic CTR falling as much as 61% when an AI Overview is present. The size of that CTR hit varies by study: Ahrefs measured a 58% reduction in clicks to the top-ranking page on informational queries, and a field study reported by Search Engine Journal found 38%. The range of 38 to 61% depending on methodology is wide, but no serious measurement finds the effect small.
The counterweight is what happens when you are the source the AI cites rather than the result it buries. Omnibound's GEO statistics roundup puts the click premium for brands cited within AI Overviews at 35% more organic clicks than uncited competitors on the same queries. And the traffic that arrives from LLM surfaces behaves differently: Similarweb's data shows LLM referral visitors converting at 5 to 15.9% depending on vertical, against a 1.76% average for classic organic search visitors. Fewer clicks, dramatically warmer ones.
Chart 4: The GEO context, external studies vs our panel's AI Citation Rate
Top rows: published external measurements. Bottom rows: share of tracked AI Overview queries where a panel page in each cohort is cited as a source (AICR), June 2026.
| Measurement | Figure | Source |
|---|---|---|
| Queries showing an AI Overview | ~48% | Seer Interactive / panel |
| Organic CTR drop when AI Overview present | 38 to 61% | SEJ field study / Ahrefs (58%) / Seer |
| Click premium for brands cited in AI Overviews | +35% | Omnibound |
| LLM referral conversion vs organic | 5 to 15.9% vs 1.76% | Similarweb |
| AICR, real-data cohort | 21% | Panel (GSC + Ahrefs) |
| AICR, template-thin cohort | 6% | Panel (GSC + Ahrefs) |
| AICR, AI-scaled cohort | 1% | Panel (GSC + Ahrefs) |
Sources: Seer Interactive (https://www.seerinteractive.com/insights/aio-impact-on-google-ctr-september-2025-update); Ahrefs (https://ahrefs.com/blog/ai-overviews-reduce-clicks-update/); Search Engine Journal (https://www.searchenginejournal.com/ai-overviews-cut-organic-clicks-38-field-study-finds/573145/); Omnibound (https://www.omnibound.ai/blog/generative-engine-optimization-statistics); Similarweb (https://www.similarweb.com/blog/marketing/geo/gen-ai-stats/). Panel figures: GSC and GA4.
The panel rows are the ones we can add to the public record. Across the 3,140 tracked queries that showed an AI Overview in June, real-data pages were cited as a source on 21% of them. Template-thin pages managed 6%. AI-scaled pages were cited on 1%, effectively never: the systems generating AI Overviews have no use for pages whose content is itself generated filler. The pattern behind the 21% was consistent: the cited pages carried named, extractable facts (a rate, a fee, a comparison figure), structured data in the server-rendered HTML, and a one-sentence answer near the top of the page that an LLM can lift cleanly.
This is why we treat GEO as an extension of the same engineering rather than a new discipline. The page that survives a core update and the page an AI Overview cites are structurally the same page. Both filters are asking the same question: is there anything here that exists nowhere else? A real dataset answers it. Nothing else does.
Our own site through the update
One property in the panel is the one you are reading. appycodes.dev is not a programmatic surface, but it went through the same discipline at small scale, and we watched it through the same window, so it belongs in the report.
When we rebuilt this site's technical SEO, we pruned the sitemap from 37 URLs down to 9 high-quality pages, then deliberately added pages back one at a time, each targeting a winnable, intent-driven query with full JSON-LD baked into the prerendered HTML. The most instructive bug from that rebuild is one we keep retelling because it generalises: the prerender pipeline was silently dropping every script tag that React Helmet emitted, which meant zero structured data was reaching Google despite all of it being present in the React tree. The schema existed, the crawler never saw it. Every rendering pipeline has a version of this failure, and it is invisible until you diff the served HTML against what you think you are serving.
Through the March update, the pruned site held every position it had and gained several. We do not present that as a controlled result, the site is small and the confounds are many, but it rhymes with the panel: fewer, denser pages beat more, thinner ones, and the update punished nobody for having a small sitemap. The pruning discipline, deciding what not to index, did as much for this site as anything we added. That work, and the audit process behind it, is the substance of our technical SEO for SaaS practice.
How we score the panel
1. Update Survival Rate (USR)
USR = Pages holding 80%+ of baseline clicks at day 60 / Total pages in cohort
The 80% threshold separates noise from damage: normal week-to-week variance on long-tail pages stays inside it, update damage does not. Day 60 after rollout completion is late enough for the reweighting to propagate through recrawls and early enough to avoid contamination from seasonal effects and later updates.
2. Data Uniqueness Score (DUS)
DUS = 100 x (variant-specific content units / total content units per page)
Scored per page, averaged per template. Content units are facts, figures, table rows, FAQ answers, and paragraph claims. The score asks how much of the page changes when the underlying entity changes. Under 20 is slot-fill; over 60 is our shipping threshold for any new template; over 80 means the data is the page.
3. AI Citation Rate (AICR)
AICR = Tracked AI Overview queries citing a panel page / Tracked queries showing an AI Overview
Measured on a fixed panel of 3,140 queries mapped to panel pages, checked via Ahrefs AI Overview tracking with manual verification on a sample. It is the GEO counterpart to CTR: not where you rank, but whether the machine reading the results considers you a source worth naming.
Recommendations
If the update hit your programmatic surface
Triage by template, using DUS. Score each template honestly, then split the surface three ways. Templates that can reach a DUS above 60 with real data you already own get upgraded: wire the dataset in, server-render it, add the worked example and per-variant FAQ. Templates that cannot reach it get pruned, with 301s to the nearest surviving parent, so the remaining pages stop being diluted by them. Nothing in our panel suggests waiting helps: deindexed scaled pages did not drift back, and every week they stay in the sitemap they spend crawl budget the survivors could use. Pruning is the unglamorous half of programmatic SEO engineering and it is where every rescue engagement we run starts.
If your surface survived
Convert survival into citations. The update cleared your long-tail competitors; AI Overviews will decide how much of the reclaimed traffic you actually receive. That means putting extractable facts and a direct answer in the first screenful, verifying the structured data lands in the served HTML rather than the JavaScript bundle, and monitoring AI Overview presence on your money queries the way you already monitor position. This is standard technical SEO for SaaS work now, not a specialist add-on, and the schema layer is measurably not optional: presence in the prerendered HTML correlated with citation across our whole panel.
If you are planning a surface from scratch
Start with the dataset, not the keyword list. The build order that survives is: acquire or compute a dataset only you can publish, design the template so the data does the differentiating, server-render with a meaningful default state, and accept the 90 to 180 day indexing curve before judging the result. If the product itself generates the data, a calculator, a pricing engine, a comparison matrix, then the SEO surface and the product are the same build, which is why these engagements often run alongside SaaS web app development rather than as a marketing project bolted on afterwards. If there is no dataset and no plan to get one, the honest advice from every number in this report is: do not build the surface.
Limitations and how to read this report critically
First, the conflict of interest is structural and we would rather name it than have you find it: the real-data cohort is largely our own work, and the AI-scaled cohort is largely work we were hired to replace. We froze cohort assignments before the rollout and scored with a written rubric, but the selection effect is real. Treat the between-cohort gap as robust and the exact percentages as ours.
Second, the update window overlapped with continued AI Overviews expansion, and the two effects pull on the same click counts. We used impression-weighted controls to separate ranking loss from CTR erosion, but the separation is imperfect, and some of the template-thin cohort's click decline is almost certainly AIO erosion rather than update demotion.
Third, AI Overview presence and citation detection is noisy: AIOs vary by location, personalisation, and day. Our AICR figures are based on one tracking configuration with manual spot checks, and we would expect other configurations to move the absolute numbers by a few points. Fourth, 14 properties is a small property sample, and two real-data templates with stale data underperformed their cohort badly enough to remind us that "real data" decays into template-thin if nobody refreshes it. The freshness half-life question belongs to our indexing decay panel, and the two datasets agree: data pipelines need maintenance windows the same way code does.
The panel at a glance
| Cohort | Pages | USR day 60 | Median clicks | Deindexed | Median DUS | AICR | SSR default state |
|---|---|---|---|---|---|---|---|
| Real-data programmatic | 622 | 81% | +11% | 2% | 74 | 21% | 92% |
| Template-thin | 531 | 47% | -22% | 9% | 38 | 6% | 31% |
| AI-scaled | 689 | 12% | -64% | 41% | 11 | 1% | 4% |
Where this leaves programmatic SEO
The phrase "programmatic SEO" now covers two opposite things, and the March 2026 update priced them apart permanently. One is a content tactic: generate many pages, harvest the long tail, hope the filters lag. That version is dead, measurably, at 12% survival and falling. The other is a data engineering discipline: own a dataset, render it properly, prune what does not earn its place, and let the surface compound through whatever Google and the AI answer engines do next. That version came through the harshest update in the category's history with more traffic than it started with.
If you are holding a programmatic surface and do not know which version you own, the fastest way to find out is to score it. Send it to us and we will run the same DUS rubric and template-level Search Console analysis from this report over your surface and send back the actual numbers.
The research that pairs with this panel:
Research
Indexing Decay: A 217-Page, 12-Month Panel on When Google Drops Stale Content
We tracked 217 pages across four content types for a year. Decay curves, half-lives, and the refresh cadence that recovers traffic.
Research
Schema.org for SaaS: JSON-LD, Rich Results and Measuring SEO Impact
Choose suitable structured data, check current search-feature support and measure impact against your own baseline.
Research
JavaScript SEO Reality Check: We Crawled 103 Funded SaaS Marketing Sites
41% of funded SaaS marketing sites are not reliably indexable. Original metrics RDI, CBE, JSC quantify the gap, and how to close it.
Research
SSR on Next.js App Router for SEO: What to Render Where, with Measurements
Server Components, Client Components, Streaming SSR, and SSG: what each one does for indexability, TTFB and LCP, with measurements across six pages we migrated.
The engagements that map to the findings:
Service
Programmatic SEO Engineering
Real-data programmatic surfaces: data architecture, template engine, SSR, pruning, monitoring.
Service
Technical SEO for SaaS
Prerender, schema, Core Web Vitals, sitemap, indexability. The engineering side of SEO.
Service
SaaS Web App Development
When the calculator, the dataset, and the SEO surface are the same build.
Frequently asked questions
- Is programmatic SEO dead after the March 2026 core update?
- No, but one version of it is. In our 1,842-page panel, AI-scaled pages with no dataset underneath survived the update at 12% and lost a median 64% of clicks. Real-data programmatic pages survived at 81% and gained a median 11%, because the update removed the sludge they were competing against. The update killed scaled content, not programmatic architecture.
- How do we get our pages cited in AI Overviews?
- Publish extractable facts that only you can publish. In our panel the pages AI Overviews cited were overwhelmingly real-data pages: named figures, per-variant numbers, structured data in the server-rendered HTML, and a clear one-sentence answer near the top of the page. Real-data pages were cited on 21% of tracked AI Overview queries; AI-scaled pages on 1%. There is no citation trick, there is only having data worth citing and making it machine-readable.
- What is GEO and how is it different from SEO?
- Generative Engine Optimisation is optimising to be cited by AI systems (Google AI Overviews, ChatGPT, Perplexity) rather than only to rank in blue links. The work overlaps heavily with technical SEO: server-rendered HTML, structured data, extractable facts, crawlable pages. The difference is the success metric: citations and LLM referral traffic instead of position and CTR. In practice the same real-data pages win both, so we treat GEO as an extension of the same engineering, not a separate discipline.
- How do we tell if the March 2026 update hit our programmatic pages?
- Segment Search Console by template, not by URL. Export clicks and impressions for each programmatic template as a group, compare an 8-week pre-update baseline against the post-rollout period, and check the Page Indexing report for pages moving to Crawled, currently not indexed. If one template lost more than 20% of clicks while your editorial pages held, the update reweighted that template. Losses concentrated in templates with low data uniqueness are the signature of the scaled-content systems.
- What counts as a good Data Uniqueness Score?
- In our rubric, pages scoring above 60 (most of the page changes when the underlying entity changes: real figures, real deltas, per-variant FAQs) survived the update at 77 to 90%. Pages under 20 (only the slot-filled tokens change between URLs) survived at 9%. The working threshold we use before shipping any template is 60, and we prune variants that cannot reach it.