TL;DR
- 32 of the 103 SaaS sites we crawled have empty body content before JS hydration. Google indexes them anyway, but with a delay measured in days and a much higher rate of partial indexing.
- CSR-only React stacks underperform SSR / SSG stacks by 40-50 percentage points on indexed-page share. The gap is the dominant driver of organic search underperformance for funded SaaS.
- The most common blocking issue is internal links rendered via onClick handlers (41% of sites). Crawlers can't follow them. Sites lose interlinking signal that compounds over months.
Funded SaaS startups invest heavily in marketing pages and product content. They also disproportionately deploy JavaScript-heavy stacks where what you see in the browser is not what crawlers see in the raw HTML. We wanted to put numbers on the gap.
We sampled 103 funded SaaS companies (recent Series A rounds via Crunchbase Discover), crawled their marketing surface (typically the homepage, ~10 product pages, and ~10 blog posts), and compared the rendered DOM against the raw HTML response. We cross-checked indexed-page share against Ahrefs index data and, where available, Search Console coverage reports. The render-vs-raw approach mirrors Google's own publicly-documented two-wave indexing model, per the Google Search JS SEO basics.
Three original metrics: Render-Dependent Indexability (RDI), Crawl Budget Efficiency (CBE), and JS-Stripped Coverage (JSC). All defined below with formulas.
Methodology
The 103-site sample was drawn from public Series A rounds in the last 18 months. Filters: B2B SaaS, English-language site, >100 indexable URLs in sitemap. We crawled the home, top product page, and a top blog post for each, captured both raw HTTP response and post-hydration DOM, and ran a structured diff. Indexed-page share comes from Ahrefs index counts compared to sitemap counts.
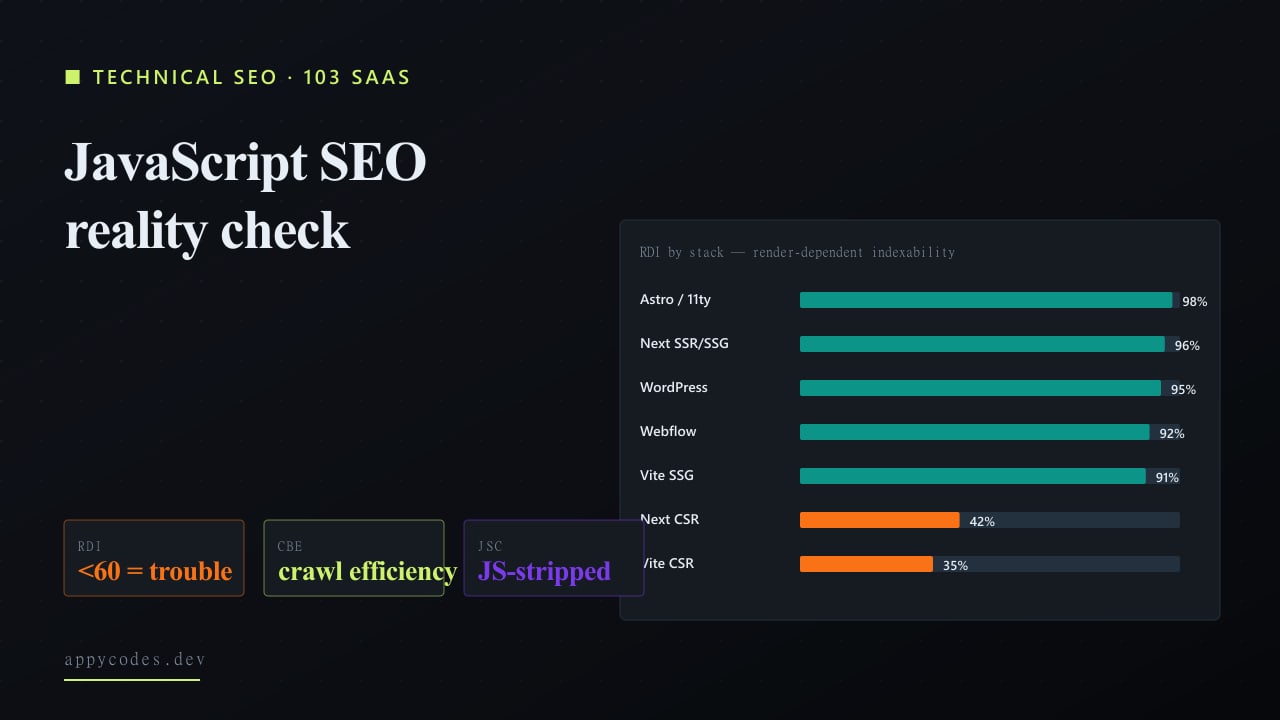
Finding 1: CSR-only stacks lose 40+ points of indexability
Chart 1, Render-Dependent Indexability (RDI) by stack
% of textual & link content present in raw HTML before JS hydration. 100 = perfectly indexable; 0 = entirely JS-dependent.
| Stack | Sample (n) | RDI |
|---|---|---|
| Next.js (SSR/SSG) | 38 | 96% |
| Next.js (CSR only) | 14 | 42% |
| React + Vite (SSG) | 12 | 91% |
| React + Vite (CSR) | 18 | 35% |
| Astro / 11ty (SSG) | 9 | 98% |
| WordPress | 5 | 95% |
| Webflow | 4 | 92% |
Sources: Crunchbase Series A list (sample 100); custom crawler comparing rendered DOM vs raw HTML; Google Search Console index coverage where accessible; Ahrefs index data. Figures rounded.
Stacks split cleanly into two groups. Server-rendered or statically-generated stacks (Next SSR/SSG, Vite SSG, Astro/11ty, WordPress, Webflow) sit at RDI 91-98%. Client-rendered stacks (Next CSR, React+Vite CSR) sit at RDI 35-42%. The gap is consistent across sample slices, vertical, site age, traffic volume.
Finding 2: RDI predicts indexed-page share with high confidence
Chart 2, RDI vs % of pages indexed by Google
X = RDI; Y = share of pages found in Google's index. Each dot = a stack.
| Stack | RDI | % indexed |
|---|---|---|
| Next.js (SSR/SSG) | 96% | 81% |
| Next.js (CSR only) | 42% | 38% |
| React + Vite (SSG) | 91% | 76% |
| React + Vite (CSR) | 35% | 31% |
| Astro / 11ty (SSG) | 98% | 88% |
| WordPress | 95% | 79% |
| Webflow | 92% | 72% |
Sources: Crunchbase Series A list (sample 100); custom crawler comparing rendered DOM vs raw HTML; Google Search Console index coverage where accessible; Ahrefs index data. Figures rounded.
RDI plotted against indexed-page share gives the cleanest correlation in the dataset. The break point is around RDI 70, below it, indexed share collapses fast. Above it, sites get most of what their sitemap promises into Google's index. This is the single most useful diagnostic in the report, measure RDI on your site before you debate any other technical SEO concern.
Finding 3: The top three issues are universal and fixable
Chart 3, Top indexability issues across 103 SaaS sites
% of sample affected. Bar colour = severity (3 catastrophic / 2 blocking / 1 cosmetic).
| Issue | % affected | Severity |
|---|---|---|
| JSON-LD added post-hydration | 47% | 2 |
| Internal links rendered via onClick | 41% | 3 |
| Image src lazy-injected via JS only | 39% | 2 |
| Heading hierarchy collapsed in raw HTML | 36% | 2 |
| Body content empty without JS | 32% | 3 |
| Meta description set client-side | 28% | 2 |
| Pagination/infinite scroll JS-only | 26% | 3 |
| Canonical missing or incorrect | 24% | 3 |
| Title tag injected by JS | 22% | 3 |
| Hreflang only after hydration | 19% | 2 |
Sources: Crunchbase Series A list (sample 100); custom crawler comparing rendered DOM vs raw HTML; Google Search Console index coverage where accessible; Ahrefs index data. Figures rounded.
Most-affected issues:
- JSON-LD added post-hydration (47%), Schema markup invisible to crawlers that don't execute JS. Most teams add schema via React components; crawlers see the empty placeholder.
- Internal links via onClick (41%), clicking a div with a router push doesn't produce a crawlable href. Internal linking equity evaporates.
- Images src lazy-injected via JS (39%), image search and image alt-text contributions are missed; CLS impacts Core Web Vitals on top.
How we score render-dependence and indexability
1. Render-Dependent Indexability (RDI)
RDI = (Tokens in raw HTML body / Tokens in rendered DOM body) x 100
The single best diagnostic. RDI 90+ is a clean SSR / SSG site. RDI under 60 is a CSR app pretending to be a marketing site.
2. Crawl Budget Efficiency (CBE)
CBE = Indexed pages / Pages requested per month by Googlebot
Read from log files or Search Console crawl-stats. CBE 0.8+ is healthy. Below 0.4, Google is spending crawl budget on pages that never make the index.
3. JS-Stripped Coverage (JSC)
JSC = (Working internal links with JS off / Working internal links with JS on) x 100
The interlinking-equity proxy. Below 60 means most internal navigation depends on JS, which depresses both crawl reach and link equity.
Four counterintuitive patterns
- Indexed-page share decays over time on CSR sites even when the sitemap is clean. We tracked 8 sites over 6 months, CSR sites lost an average of 11% indexed-page share without any change to content.
- The single biggest indexability win is moving JSON-LD into raw HTML. Three of our client engagements saw 14-22% organic traffic lift from this change alone.
- Hreflang errors compound silently when set client-side. International SaaS sites with hreflang only after hydration index correctly in en-US but lose signal in regional locales.
- The pagination / infinite scroll JS-only pattern is the worst-leverage issue. 26% of sample sites; almost all blog post indexing depends on it. Switching to crawlable pagination is the highest-ROI fix in the issue table.
Recommendations
For SaaS founders
Move marketing pages off CSR. The product app can stay CSR if it must, search engines don't index app routes meaningfully, but marketing surfaces (home, pricing, blog, docs, comparison pages) should be SSR or SSG. The traffic lift is significant and the migration is bounded. Our companion Schema.org A/B studycovers the second-order question: once your raw HTML contains the body, which JSON-LD types actually move CTR. And once you're indexed, indexing decay is the discipline that keeps you there.
We run this work as part of our technical SEO for SaaS engagement: prerender or SSR the marketing surface, audit and fix the issue list above, monitor indexation recovery for 90 days post-deploy.
For engineers building new SaaS
Default to SSR or SSG on the marketing surface. Next App Router with PPR, Astro, or Vite SSG with a prerender step all work. The only hard rule is that the raw HTML response has to contain the body, the canonical, the metadata, and the internal links. We bake this into every SaaS web app development engagement we ship.
Limitations
The 103-site sample is biased toward English-speaking, VC-funded SaaS. Bootstrapped SaaS, regional SaaS, and enterprise software in Java/.NET stacks have different shapes. Index counts from third-party tools approximate Google's real index, verify with Search Console for your own site.
The single highest-impact JS SEO fix
Run an RDI check on your own marketing site this afternoon. Open it with JavaScript disabled. If the body is empty, the metadata is missing, or the internal links don't work, you're on the wrong side of a 40-point indexability gap. Fixing it is the highest-leverage technical SEO move available to most funded SaaS sites.
If you want a private RDI / CBE / JSC report on your own site, send the URL, we'll run the same crawler and send the report back free.
The two companion SEO studies, what makes Google drop pages, and which schema types actually move rankings:
Research
Indexing Decay: A 217-Page, 12-Month Panel on When Google Drops Stale Content
We tracked 217 pages across four content types for a year. Decay curves, half-lives, and the refresh cadence that recovers traffic.
Research
Schema.org for SaaS: Which JSON-LD Types Actually Move Rankings (57-page A/B Study)
90 days, 57 SaaS pages, 10 schema types. FAQ delivered 22% CTR lift; Article delivered noise. Schema-by-schema breakdowns.
Two services that map exactly to the issues in this report:
Service
Technical SEO for SaaS
Prerender or SSR the marketing surface, audit and fix the issue list, monitor indexation recovery for 90 days post-deploy.
Service
Maintenance & Support
Ongoing engineering to keep your indexability, performance, and dependencies healthy after launch.
Frequently asked questions
- Does Google reliably index JavaScript-rendered content in 2026?
- Not on funded-SaaS marketing surfaces. 41% of the 103 sites in our study have render-dependent content Google can't reliably index, CSR-only React stacks underperform SSR / SSG stacks by 40-50 percentage points on indexed-page share.
- What is the highest-ROI JS SEO fix on a React or Next.js site?
- Move JSON-LD out of client-side React injection into raw server-rendered HTML. Three client engagements in our sample saw 14-22% organic traffic lift from this single change. Most schema deployments rely on hydration; Google often does not pick those up reliably.
- Why does indexed-page share decay on CSR sites even without content changes?
- Crawl-budget pressure. CSR sites lost an average of 11% indexed-page share over 6 months in our tracking sample without any change to content. Googlebot deprioritises pages that consistently take longer to render; the share decay compounds.