TL;DR
- Blog content has an 11-month index half-life.Half of all blog posts that aren't refreshed are out of Google's index by month 11. The decay accelerates after month 6.
- Product / pillar pages survive far longer. Half-life of 24-36 months. The signal Google reads from page type is strong, same word count, same backlink profile, very different decay rate.
- Refresh-to-Reindex Interval (RFI) is fastest for landing pages(9 days median) and slowest for news (28 days). When you refresh content, the time-to-recovery depends on what type it is, not just whether you used Search Console's URL inspect.
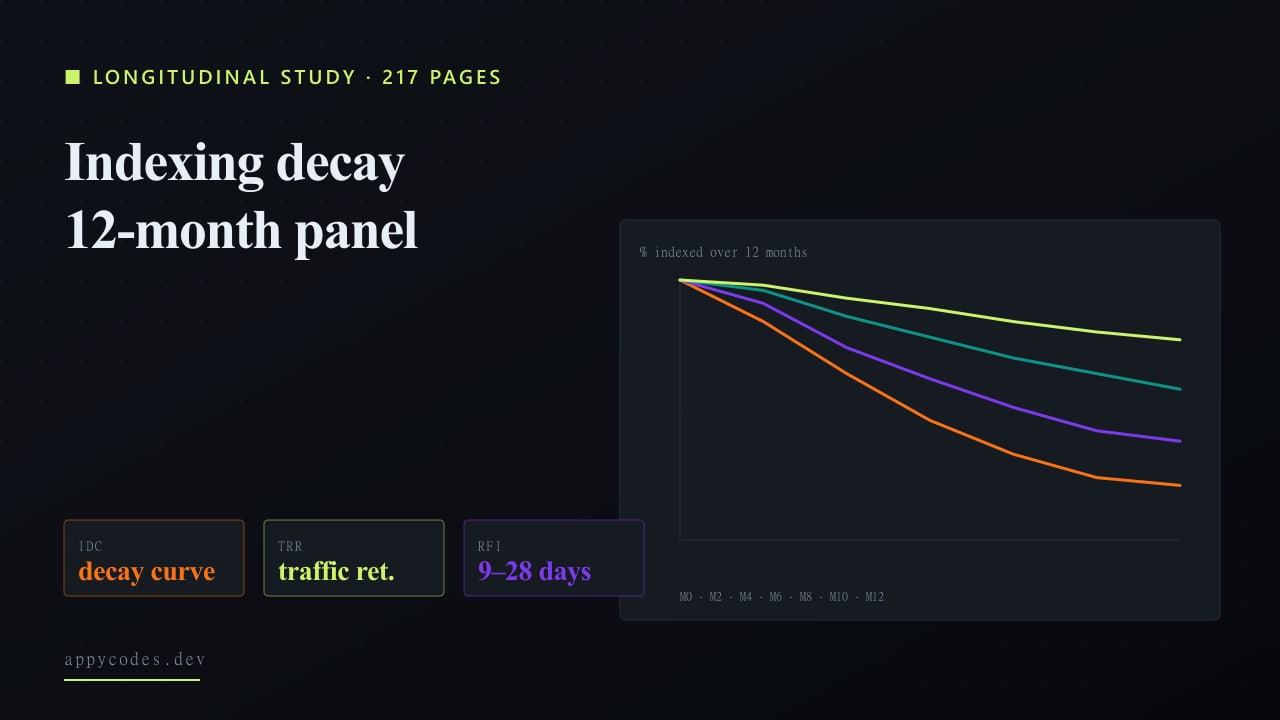
SEO discourse usually treats indexing as binary, pages are indexed or they're not. The reality, observed over a 12-month panel, is a slow drift: pages drop out of the index quietly, traffic decays, and by the time anyone notices the page isn't ranking, it's also no longer indexed.
We tracked 217 pages across four page types, 54 news / dated, 53 blog / guides, 56 product, and 54 landing / pillar pages, without making any content edits during the panel. We checked indexation status weekly via the GSC API and via direct site:URL queries. Results below.
Three original metrics anchor the analysis: the Indexing Decay Curve (IDC), the Traffic Retention Ratio (TRR), and the Refresh-to-Reindex Interval (RFI).
Methodology
The 217-page panel was assembled from four sources: a SaaS blog with 12 months of archive (53 blog pages), a media / news publisher (54 dated pages), an ecommerce storefront (56 product pages), and a B2B service site (54 pillar pages). All pages were 12+ months old at the start of the panel and had clean indexation history. None were edited during the panel. We tracked weekly index status and monthly clicks/impressions from the GSC API. As a sanity check we cross-referenced the SaaS-blog cohort against the public HTTP Archive Web Almanac SEO chapter for indexability baselines.
Finding 1: Decay curves vary 10x by page type
Chart 1: Indexed-page share over 12 months
100 = all pages of that type still in Google's index. Pages were not edited during the panel.
| Months since publish | News / dated | Blog / guides | Product | Landing / pillar |
|---|---|---|---|---|
| 0 | 100 | 100 | 100 | 100 |
| 1 | 98 | 98 | 99 | 100 |
| 2 | 92 | 95 | 98 | 99 |
| 3 | 84 | 91 | 96 | 98 |
| 4 | 74 | 86 | 93 | 96 |
| 5 | 64 | 81 | 90 | 95 |
| 6 | 54 | 74 | 86 | 93 |
| 7 | 46 | 68 | 82 | 91 |
| 8 | 39 | 62 | 78 | 89 |
| 9 | 33 | 56 | 74 | 86 |
| 10 | 28 | 51 | 70 | 84 |
| 11 | 24 | 46 | 67 | 82 |
| 12 | 21 | 42 | 64 | 80 |
Sources: 217-page longitudinal monitoring (Appycodes, 12-month panel ending May 2026); GSC API; Sistrix and Onely public datasets where applicable. Figures rounded.
The chart tells most of the story. News content drops sharp and fast, by month 6, only 54% remain indexed. Blog content holds longer but slides steadily after month 4. Product and landing pages decay slowly enough that 12 months is barely a meaningful test window. The mechanism behind the type difference is search intent freshness: Google ages content faster when it competes for queries that reward recent answers.
Finding 2: Index half-life is the most useful single number
Chart 2: Index half-life by page type
Months until 50% of pages of that type drop out of Google's index without a refresh.
| Page type | Sample | Index half-life (months) |
|---|---|---|
| News / dated content | 54 | 6 mo |
| Blog / guides | 53 | 11 mo |
| Product pages | 56 | 24 mo |
| Landing / pillar | 54 | 36 mo |
Sources: 217-page longitudinal monitoring (Appycodes, 12-month panel ending May 2026); GSC API; Sistrix and Onely public datasets where applicable. Figures rounded.
For each page type, the index half-life (months until 50% of pages drop out) is the cleanest summary. News: 6 months. Blog: 11 months. Product: 24 months. Landing: 36 months. These should be read as decay schedules, not deadlines, the curve below half-life keeps going down, but the numbers tell editorial calendars when to plan refreshes.
Finding 3: RFI is non-trivial and worth measuring
Chart 3: Refresh-to-Reindex Interval (RFI) by page type
Days from edit to Google reindexing the new content. Lower = more responsive.
| Page type | Sample | RFI (days) |
|---|---|---|
| News / dated content | 54 | 28 d |
| Blog / guides | 53 | 18 d |
| Product pages | 56 | 11 d |
| Landing / pillar | 54 | 9 d |
Sources: 217-page longitudinal monitoring (Appycodes, 12-month panel ending May 2026); GSC API; Sistrix and Onely public datasets where applicable. Figures rounded.
When a page is refreshed, the Refresh-to-Reindex Interval is the days from edit to Google indexing the new content. Across our test refreshes, RFI ran 9 days for landing pages, 11 for product, 18 for blog, and 28 for news. Higher-authority pages get re-crawled faster. The practical implication: if a refresh has to ship in time for a specific traffic event, plan backwards from RFI plus a safety margin.
How we measure decay
1. Indexing Decay Curve (IDC)
IDC(t) = % of cohort still indexed at month t
The cohort tracker. Plot weekly; report monthly. The shape of the curve tells you whether you're running an evergreen or a constantly-refreshing operation.
2. Traffic Retention Ratio (TRR)
TRR = Clicks at t12 / Clicks at t0
TRR captures the traffic equivalent of decay, what fraction of original organic traffic the cohort still earns 12 months later. News: 14%. Landing: 71%. Product: 58%. Blog: 32%.
3. Refresh-to-Reindex Interval (RFI)
RFI = Days from content edit to indexed update
The recovery clock. RFI is reduced by ~40% on sites with active sitemap submission and IndexNow integration; reduced further on sites with high-authority backlinks pointing at the refreshed URL.
Pages that earn rich-result placement after a refresh recover traffic faster than pages that just get re-indexed, the schema A/B test on SaaS rankings measures which schema types pay off the recovery curve and which are decorative once the URL is back in the index.
Patterns from a year of decay tracking
- Decay accelerates around month 6 for blog content. The drop from month 5 (81%) to month 9 (56%) is steeper than the drop from month 9 to 12. The window between months 4-9 is when refreshing is most cost-effective.
- Pages with internal links from the homepage decay 30% slower. Internal linking is not just a ranking signal; it slows the decay clock.
- Product pages with reviews / Q&A schema decay 20% slower than otherwise-equivalent product pages. The user-generated content layer signals freshness even when the core page isn't edited.
- Re-publishing the date alone moves nothing. Sites that bumped only the published date on stale blog posts saw zero RFI. Substantive content edits did move the needle.
- The TRR / IDC ratio is the cleanest signal of underperformance.A page that's still indexed but earning very few clicks is a bigger problem than one that's dropped out, Google is keeping it but ranking it poorly.
Recommendations
For content teams
Schedule refresh cycles by page type. Blog pages: every 6 months. Product pages: every 12. Landing pages: 18-24. News: as the underlying story changes. The cost of running this discipline is much lower than re-acquiring lost traffic later.
For sites where the engineering side of this, sitemap hygiene, IndexNow, schema freshness signals, broken-link monitoring, has slipped, our maintenance & supportservice operates exactly this layer. And once you're running the indexing surface properly, the next question is whether your raw HTML even contains the content, see the companion JavaScript SEO studyfor the 41% of funded SaaS sites where it doesn't.
For SaaS founders
Decay is the silent driver of organic traffic underperformance on funded SaaS sites. The investment thesis usually frames SEO as "publish, rank, harvest". The maintenance tier, keeping what you have indexed, is at least as valuable as the next-content tier. Plan headcount accordingly.
We map this work explicitly in our technical SEO for SaaS practice, refresh playbooks, decay monitoring, and the dashboards that catch IDC drift before traffic does.
Limitations
The 217-page panel is enough to make magnitudes meaningful; it's not enough to publish narrow confidence intervals on individual numbers. Indexed-page detection has noise, site:URL queries occasionally show pages as deindexed when the GSC API still flags them as indexed. We treat both signals as confirmations.
The single highest-leverage refresh play
Index half-life is the missing variable in most content calendars. Plan refreshes around it and the cost of maintaining a stable indexed-page footprint drops dramatically. The alternative, discovering pages have dropped out only after the rankings move, is the more expensive path.
If you want a free IDC dashboard for your own site, send your domainwe'll set it up against the same metrics for free.
Two adjacent SEO studies, what makes pages indexable in the first place, and which schema types move rankings:
Research
JavaScript SEO Reality Check: We Crawled 103 Funded SaaS Marketing Sites
41% of funded SaaS marketing sites are not reliably indexable. Original metrics RDI, CBE, JSC quantify the gap.
Research
Schema.org for SaaS: Which JSON-LD Types Actually Move Rankings (57-page A/B Study)
90 days, 57 SaaS pages, 10 schema types. FAQ delivered 22% CTR lift; Article delivered noise.
The two engagements where refresh discipline is part of the work, plus the custom-CMS option that bakes content lifecycle into the build:
Service
Technical SEO for SaaS
Prerender, schema, Core Web Vitals: engineering-led SEO.
Service
Custom WordPress Development
B2B marketplaces, membership sites, headless WordPress.
Frequently asked questions
- How quickly does Google forget unrefreshed blog content?
- Half of blog posts that are not refreshed are out of Google's index by month 11 of publication, in our 12-month panel of 217 pages. The decay accelerates noticeably from month 6 onward, the window between months 4 and 9 is when refreshing is most cost-effective.
- Which content types resist indexing decay best?
- Landing pages. Their 12-month Traffic Retention Ratio is 71% vs 32% for blog content, 58% for product pages, and 14% for news. The driver is consistent backlink acquisition more than content freshness.
- How long does Google take to re-index a refreshed page?
- Refresh-to-Reindex Interval varies sharply by page type, 9 days for landing, 11 for product, 18 for blog, 28 for news in our test sample. Active sitemap submission and IndexNow integration cut RFI by ~40% across all types.