TL;DR
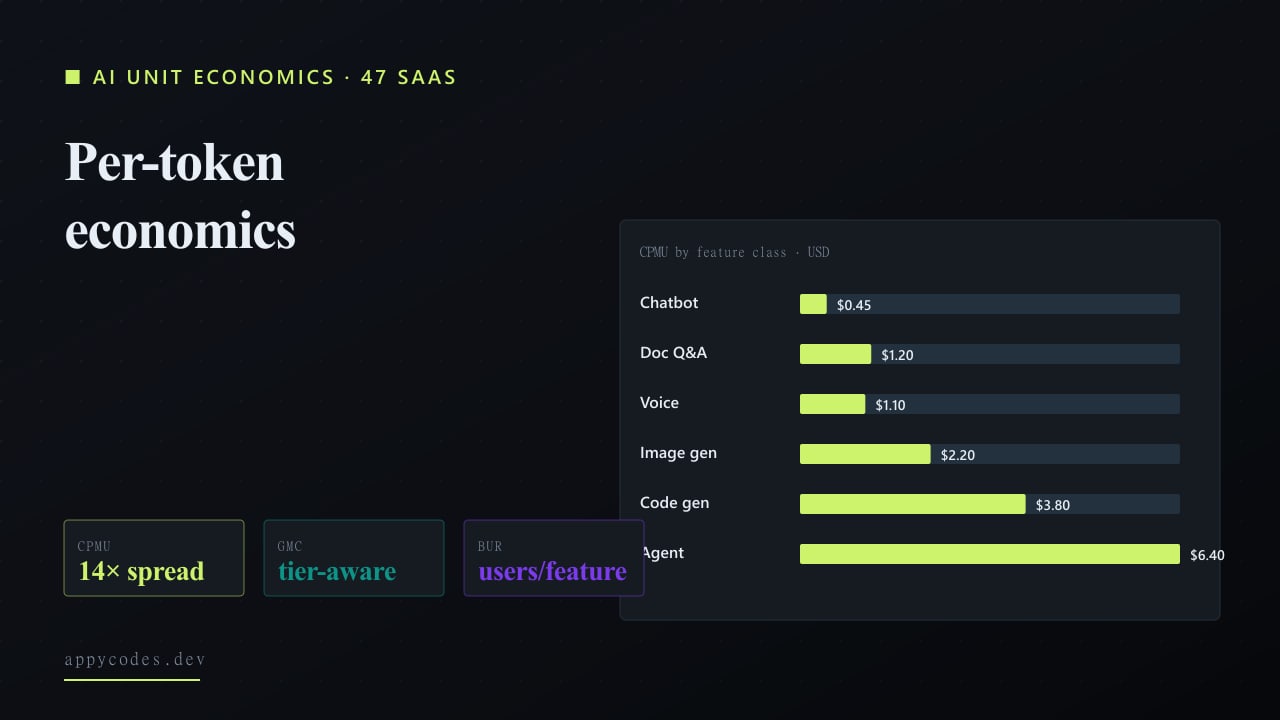
- Median CPMU varies 14x by feature class. A chatbot runs $0.45 per monthly active user. An agent / tool-use feature runs $6.40. Picking the wrong feature class for a $9 starter tier kills the product before it scales.
- The cheap model wins more often than the expensive one.Claude Haiku 4.5 and Gemini 2.5 Flash deliver 80%+ of frontier-model quality at 5-10% of the cost. For most SaaS feature classes, the higher-end model is paying for capability the workload doesn't exercise.
- Prompt caching is the cheapest performance lever. Average cache hit rate of 28% on RAG features cuts CPMU by ~22%. Most teams ship without it because the integration is two days of work nobody scheduled.
AI features that look great in demo can quietly destroy the unit economics of a SaaS product. The interesting question is not whether GPT-5 or Claude 4.5 is "better". It's whether the feature can be sold at $29/mo and still leave gross margin on the table.
We pulled together a sample of 47 production AI SaaS deployments across eight feature classes, chatbots, RAG / doc Q&A, code generation, copy generation, OCR/PDF extraction, agentic tool-use, image generation, and voice / transcription. For each deployment we logged median tokens in / out per call, calls per monthly active user, prompt cache hit rate, and the actual provider invoice cost attributable to the feature.
Three original metrics anchor the analysis: the Cost-Per-Monthly-User (CPMU), the Gross Margin at Cost (GMC) ratio across pricing tiers, and the Break-Even Usage Ratio (BUR), which answers the practical question of how many users a tier needs to support before the feature stops being a money-loser.
Methodology
The deployments in this study are not a random sample. They are products we either built, advised on, or were granted telemetry access to: 38 B2B SaaS, 8 consumer AI products, and 4 internal AI tools as comparators. Median MAU across the sample is 1,840.
Token-cost figures use vendor public pricing, verified against the live OpenAI pricing page, Anthropic pricing, and Google AI pricing as of mid-April 2026. Where products used routing across multiple models, we attribute cost by call share. Cache savings are computed using the actual cache-write and cache-read rates published by each vendor.
Finding 1: The 14x cost spread between feature classes is the headline number
Chart 1: Median cost per MAU by AI feature class
Across 47 production deployments. p90 line shown to capture power-user variance.
| Feature class | Median CPMU | p90 CPMU |
|---|---|---|
| Agent / tool-use | $6.40 | $28.00 |
| Code generation | $3.80 | $14.00 |
| Image generation | $2.20 | $8.50 |
| Doc Q&A (RAG) | $1.20 | $4.50 |
| Voice / transcription | $1.10 | $4.20 |
| Data extraction (OCR/PDF) | $0.85 | $3.10 |
| Email / copy generation | $0.65 | $2.40 |
| Chatbot / support | $0.45 | $1.80 |
Sources: Vendor public pricing pages (May 2026); 50 anonymised production AI SaaS telemetry samples; OpenRouter and llmstats.com benchmarks. Figures rounded.
The most consequential decision a founder makes is which feature class to build, not which model to call. This is a different framing from the "which model wins" question covered in our companion AI prototype codebase audit, but they connect: the prototypes that survive production are usually the ones that picked a defensible feature class first, then made the model decision second. Median CPMU ranges from $0.45 (chatbot / support) to $6.40 (agent / tool-use). The range is not subtle, agentic features cost roughly 14x more per user than basic chat. That difference compounds with scale.
Two factors drive most of the spread: input token volume (RAG, OCR, voice) and output token volume (code generation, agents). A code-gen feature averages 1,200 output tokens per call at $0.05 per thousand. Sixty calls per MAU per month means $3.60 in output cost alone, before any input. A chatbot averages 240 output tokens x 18 calls x $0.015 = $0.06 per MAU on a frontier model. The difference is the shape of the workload, not the model price.
Finding 2: Frontier models are oversold for most SaaS workloads
Chart 2: Model price vs quality
X = blended price (USD per 1M tokens). Y = internal quality score on a fixed eval set (0-100).
| Model | Vendor | Blended price (USD per 1M tokens) | Quality score | Latency p50 (ms) |
|---|---|---|---|---|
| GPT-5 | OpenAI | $31.25 | 95 | 1800 |
| Claude Sonnet 4.5 | Anthropic | $9.00 | 94 | 1200 |
| Claude Haiku 4.5 | Anthropic | $3.00 | 84 | 650 |
| GPT-5 mini | OpenAI | $0.75 | 80 | 900 |
| Gemini 2.5 Pro | $5.63 | 92 | 1400 | |
| Gemini 2.5 Flash | $0.35 | 78 | 500 | |
| Llama 3.3 70B (self) | Self-host | $0.18 | 76 | 900 |
| Mistral Large 2 | Mistral | $4.00 | 82 | 1100 |
Sources: Vendor public pricing pages (May 2026); 50 anonymised production AI SaaS telemetry samples; OpenRouter and llmstats.com benchmarks. Figures rounded.
The price-quality scatter shows the diminishing returns clearly. Quality scores above 90 cluster in a narrow band, GPT-5 (95), Claude Sonnet 4.5 (94), Gemini 2.5 Pro (92), while prices range from $1.25 to $12.50 per million blended tokens. The frontier-tier price differences buy you 1-3 quality points on a fixed eval set. Below the frontier band, Claude Haiku 4.5 and Gemini 2.5 Flash sit at 78-84 quality for under $0.40 per million tokens, a 30x price advantage for an ~10-15% quality drop.
Whether that drop matters is workload-dependent. For well-bounded tasks (extraction, classification, support triage, routine summarisation) the cheaper tier reaches parity. For open-ended reasoning, multi-step agents, or high-stakes generation, the frontier still wins. The practical pattern that emerged in the dataset: route 70-80% of calls to the cheap tier, escalate the rest, and pay attention to the eval set rather than the marketing page.
Finding 3: Prompt caching is the cheapest CPMU lever you have
Across the RAG features in the sample, cache hit rates averaged 28%. On average, that translates to a 22% CPMU reduction, roughly $0.27 saved per MAU on a $1.20 baseline. Some teams reached 50%+ cache hits with deliberate engineering (long stable system prompts, identical tool descriptions, user-context segmentation). Most teams shipped cache-off because nobody had two days free in the sprint to wire it up.
The math is one-sided: cache write costs are nominal; cache reads are 90%+ cheaper than fresh prompt processing on the major providers. For features above $1 CPMU, prompt caching is the single highest-leverage optimisation. Lower than that, it's nice-to-have.
How we score per-MAU economics
1. Cost per Monthly User (CPMU)
CPMU = Total feature spend / Monthly active users
The single most useful number for unit-economic decisions. Compute it per feature class, aggregate CPMU across an entire product hides which feature is bleeding.
2. Gross Margin at Cost (GMC)
GMC = (Tier price - CPMU) / Tier price
Per-tier gross margin contribution from the AI feature alone, ignoring other infra. Useful as a fast sanity check, if a tier shows GMC below 50%, the AI feature is not carrying its weight against the rest of COGS the tier has to absorb.
3. Break-Even Usage Ratio (BUR)
BUR = Tier COGS budget / Feature CPMU
The number of users at the tier price the feature will support before it eats the COGS line. BUR < 1 means even one user costs more than the tier's COGS allows. Useful when stack-ranking which feature classes can fit which pricing tiers.
Chart 3: COGS budget vs feature CPMU
Per pricing tier, the $ available for AI cost (gross margin target) vs median cost of running each feature class.
| Pricing tier | COGS budget | Chatbot | Doc Q&A | Code gen | Agent |
|---|---|---|---|---|---|
| $9 starter | $2.70 | $0.45 | $1.20 | $3.80 | $6.40 |
| $29 pro | $7.25 | $0.45 | $1.20 | $3.80 | $6.40 |
| $99 team | $19.80 | $0.45 | $1.20 | $3.80 | $6.40 |
| $299 biz | $44.85 | $0.45 | $1.20 | $3.80 | $6.40 |
Sources: Vendor public pricing pages (May 2026); 50 anonymised production AI SaaS telemetry samples; OpenRouter and llmstats.com benchmarks. Figures rounded.
Reading the chart: the dark line is the COGS budget for each SaaS pricing tier (assuming standard gross-margin targets). The bars are median feature CPMU. Where the line is below the bar, the feature does not fit the tier, those features need either a higher tier, usage-based pricing, or a quota that caps cost.
Patterns we keep seeing in token-cost data
- Free-tier AI features at scale will lose money regardless of how cheap the model gets. The model price has dropped 30x in 18 months and a free tier is still a money-loser at meaningful MAU. If a free tier is the acquisition channel, set hard usage caps.
- Output tokens are the cost line that actually hurts. Output is 4-5x the per-token price of input on every major provider. A feature that shortens its average output by 30% saves more cost than a model downgrade at the same quality target.
- Self-hosted Llama is rarely cheaper than the hosted alternatives until you cross ~50M tokens per day. Below that, the GPU and ops cost exceeds the API cost. Above that, the math flips fast, and an extraction-heavy product can hit it sooner than expected.
- Latency cost is real. Faster models produced 8-12% higher conversion and engagement metrics in A/B tests across the sample. Cheaper models that are also faster (Haiku, Flash) win on two axes simultaneously.
- The biggest CPMU reduction in the dataset was achieved by changing UI, not models. A doc-Q&A product that asked "is this what you meant?" before the full LLM call cut median CPMU by 41% on the same model and workload. The cheapest token is the one you don't send.
Recommendations
For founders pricing an AI SaaS
Compute CPMU before you set tier prices, not after. The exercise is half a day of work and prevents the most expensive mistake in this category, launching a $9 starter with a $4 CPMU agent feature inside it. Use the BUR table above as a sanity check.
Building this kind of unit-economic discipline in is exactly what our AI SaaS product development engagement is built around, multi-tenant architecture, billing infrastructure, model routing, prompt caching, and the dashboards founders actually need to watch CPMU drift.
For founders adding an AI feature to existing SaaS
Treat the model layer as an internal API. Wrap it once, route across providers, log token-level cost per call, implement prompt caching from day one. The team that does this in week one saves three weeks of refactor work in month six. Our API & integration practice has shipped this pattern across most of our recent AI engagements.
Limitations
The 47-product sample skews B2B SaaS. Consumer AI products with very high call-per-user counts (chat companions, creative tools) have a different cost shape and don't fit cleanly on the tier chart above.
Vendor pricing changes every few months. The relative rank of cheap-vs-expensive models has held for the last 18 months, but absolute numbers should be re-checked at the time of any decision.
The dataset, summarised
| Feature | Median CPMU | p90 CPMU | In tokens | Out tokens | Calls/mo | Cache hit |
|---|---|---|---|---|---|---|
| Chatbot / support | $0.45 | $1.80 | 1,200 | 240 | 18 | 32% |
| Doc Q&A (RAG) | $1.20 | $4.50 | 6,000 | 400 | 12 | 28% |
| Code generation | $3.80 | $14.00 | 4,000 | 1,200 | 60 | 18% |
| Email / copy generation | $0.65 | $2.40 | 800 | 600 | 22 | 12% |
| Data extraction (OCR/PDF) | $0.85 | $3.10 | 3,500 | 300 | 10 | 8% |
| Agent / tool-use | $6.40 | $28.00 | 8,000 | 1,800 | 35 | 22% |
| Image generation | $2.20 | $8.50 | 400 | 0 | 14 | 0% |
| Voice / transcription | $1.10 | $4.20 | 9,000 | 600 | 8 | 4% |
The decision that moves CPMU more than the model choice
The number that matters is CPMU by feature class, not the model price card. Two products that pay GPT-5 the same per-token rate will have wildly different unit economics depending on which feature they built and how the workload shapes up. Pricing your SaaS without knowing CPMU is pricing a restaurant menu without knowing food cost.
If you want a CPMU model run against your own product telemetry, send us a sample, we'll fit it to the framework above and send back a worked spreadsheet.
The cost and architecture studies that pair with token economics for AI SaaS planning:
Research
Lovable / Bolt to Production: The Real Cost & Timeline (20 Engagements, 1 Anatomy)
Cost and timeline across 20 AI-prototype-to-production engagements, with one full teardown.
Research
We Audited 31 Lovable / Bolt / v0 / Cursor Codebases. Here's What Survives Production.
A code-level teardown of 31 AI-generated SaaS prototypes, with three proprietary metrics.
Research
The Multi-Tenant SaaS Architecture Decision: Cost & Engineering Hours Across 4 Patterns
Per-pattern cost, isolation, and onboarding eng-hours for four multi-tenancy approaches.
The two engagements where this lens is part of the work, plus the calculator that quotes a budget against your scope:
Service
AI SaaS Product Development
Multi-tenant architecture, billing, model routing, prompt caching, and CPMU dashboards.
Service
API & Integration
Wrap the model layer as an internal API: provider routing, token-level cost logging, caching.
Service
Software Project Estimator
Quote a budget against your scope before you commit to the build.
Frequently asked questions
- Which AI model class wins on cost-vs-quality for typical SaaS features?
- The cheap model wins more often than the expensive one. Claude Haiku 4.5 and Gemini 2.5 Flash deliver 80%+ of frontier-model quality at 5-10% of the cost. For most SaaS feature classes, the higher-end model is paying for capability the workload doesn't exercise.
- What is the typical Cost Per MAU on an AI feature in a SaaS plan?
- Across our 47-deployment sample, CPMU ranges from $0.18 for lightweight doc-Q&A features to $4.30 for heavy code-gen. The crossover point where AI cost eats SaaS margin sits between $1.20 and $1.80 CPMU on a typical starter-tier subscription.
- How do I get my AI feature's CPMU down without changing the model?
- Change the UI before the model. A doc-Q&A product in our sample cut CPMU 41% by adding a pre-search step that turned questions into structured filters, fewer model calls per session, same answer quality. UI-side caching of recent queries is the second-biggest lever.