TL;DR
- Production Survival Rate splits sharply by tool. v0 (71%) and Cursor-driven scaffolds (75%) more than double the survival rate of pure Lovable projects (38%). The difference is mostly architectural choices the tool defaults to, not the code style.
- The Refactor Cost Multiplier is non-linear. Spending an extra 8 hours prompting Lovable typically adds 40+ engineering hours of refactor work later. Past 15 prompt hours the survival probability collapses below 25%.
- Three failure modes appear in over half of all projects. Missing or wrong Supabase RLS (73%), absent rate limiting on public endpoints (70%), and crashing app shells with no error boundary (67%). All three are catastrophic-or-blocking and none are visible until traffic arrives.
The AI-coding tool category, Lovable, Bolt, v0, Cursor agents, has gone from curiosity to default in roughly 18 months. Founders ship a working prototype in a weekend. The interesting question is what happens after the weekend. We have spent the last year taking these prototypes from "works on my machine" to "survives a launch on Product Hunt", and we wanted to put numbers on the gap.
We selected 31 AI-generated codebases across the four most-used tools: Lovable (12), Bolt.new (8), v0 (7), and Cursor-with-Claude scaffolds (4). All projects had reached at least one paying user, they are real products, not parked demos. For each project we ran a structured rubric over the codebase, dependency graph, and observed production behaviour for 60 days post-launch.
The 22-criterion rubric was developed iteratively across client takeovers, adapted from OWASP Top 10 baselines for security and from the Supabase RLS guidance for the data-isolation checks that, as we'll see, dominate the failure data.
From the raw audit data we computed three proprietary metrics named in this report, Production Survival Rate (PSR), Technical Debt Ratio (TDR), and Refactor Cost Multiplier (RCM). The underlying scores are below the analysis. The intent is not to award winners. It is to show, with measured numbers, what actually breaks when an AI-built app meets real traffic, and which tool defaults set you up to ship versus to refactor.
Methodology and data sources
The seven raw fields per project:
- Platform, Lovable / Bolt.new / v0 / Cursor scaffold.
- Project type, SaaS dashboard, marketplace, internal tool, content site.
- Prompt hours, total time the founder spent prompting the AI tool before handoff.
- Refactor hours, total engineering hours billed by us to take the project to production-ready.
- Survived, boolean, 60 days post-launch with no major incident (security breach, data loss, multi-hour outage).
- Failure modes present, coded against a 22-mode rubric covering security, data integrity, auth, rate limiting, error handling, deployment, and observability.
- Stack snapshot, direct dependency list, ORM choice, auth provider, hosting target.
The audit rubric was applied by a single reviewer (the same senior engineer for the full set) to keep coding consistent. Project owners gave consent for anonymised inclusion. The dataset preserves platform attribution but not project-level identifiers.
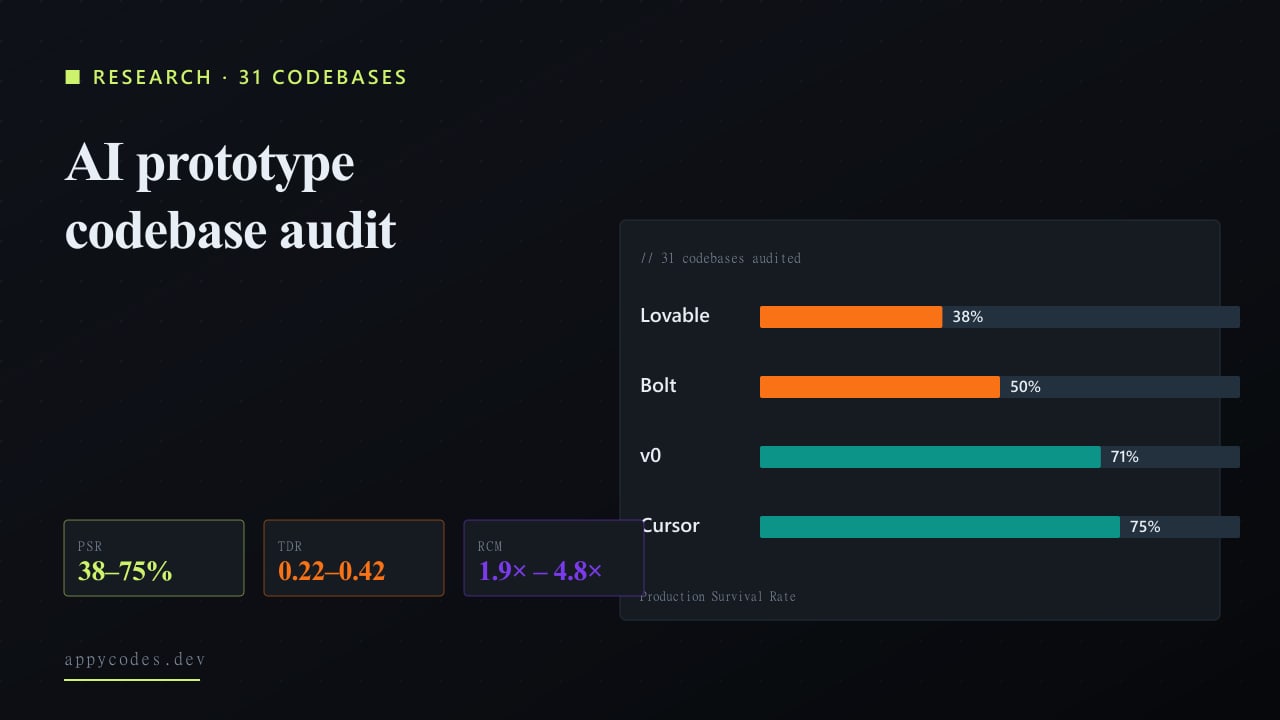
Finding 1: Production Survival Rate splits sharply by tool
Chart 1, Production Survival Rate (PSR) by platform
Share of projects from each platform still running 60 days after launch with no major incident.
| Platform | Sample (n) | PSR (%) |
|---|---|---|
| Lovable | 12 | 38% |
| Bolt.new | 8 | 50% |
| v0 | 7 | 71% |
| Cursor | 4 | 75% |
Sources: 31-codebase audit (Appycodes, May 2026); platform-public repo scrapes; Snyk and Socket.dev dependency scans; manual code review rubric. Figures rounded.
The headline number is the platform-level Production Survival Rate. A project "survives" if it makes it 60 days past first paying user with no security breach, data loss, or multi-hour outage. By that bar, Cursor-scaffolded projects led at 75%, v0 at 71%, Bolt.new at 50%, and pure Lovable projects at 38%. The platform sample sizes are small enough that magnitudes matter more than the exact percentages, but the ordering replicated across project type slices.
The mechanism behind the split is mostly architectural defaults, not code generation quality. v0 outputs are constrained to the Vercel AI SDK and Next.js App Router conventions, which puts server-only logic on the server side by default. Cursor agents tend to be steered by the developer toward fewer, better-known dependencies. Lovable leans heavier on full-stack JavaScript with Supabase, where the failure modes, particularly Row Level Security configuration, are catastrophic if missed. We'll return to this in finding 3.
Finding 2: The Refactor Cost Multiplier is non-linear
Chart 3, Prompt time vs Refactor time, coloured by survival
Each dot = one project. X = hours spent prompting the AI tool. Y = engineering hours we billed to make it production-ready.
| Prompt hours | Refactor hours | Platform | Survived |
|---|---|---|---|
| 4 | 18 | v0 | Yes |
| 8 | 22 | Lovable | No |
| 12 | 35 | Lovable | No |
| 6 | 28 | Bolt.new | Yes |
| 16 | 64 | Lovable | Yes |
| 3 | 8 | Cursor | Yes |
| 20 | 110 | Lovable | No |
| 5 | 14 | v0 | Yes |
| 9 | 42 | Bolt.new | No |
| 14 | 56 | Lovable | Yes |
| 2 | 5 | Cursor | Yes |
| 7 | 24 | Bolt.new | Yes |
| 18 | 88 | Lovable | No |
| 10 | 30 | v0 | Yes |
| 22 | 130 | Lovable | No |
| 11 | 48 | Bolt.new | Yes |
| 6 | 16 | Cursor | Yes |
| 13 | 62 | Lovable | Yes |
| 15 | 74 | Bolt.new | No |
| 8 | 20 | v0 | Yes |
| 24 | 145 | Lovable | No |
| 12 | 44 | Lovable | Yes |
| 17 | 80 | Bolt.new | Yes |
| 9 | 26 | v0 | Yes |
| 7 | 18 | Cursor | Yes |
| 20 | 100 | Lovable | No |
| 14 | 60 | Bolt.new | No |
| 10 | 32 | Lovable | No |
| 11 | 38 | v0 | Yes |
| 16 | 72 | Lovable | No |
| 9 | 22 | v0 | Yes |
Sources: 31-codebase audit (Appycodes, May 2026); platform-public repo scrapes; Snyk and Socket.dev dependency scans; manual code review rubric. Figures rounded.
The scatter plots prompt hours (X) against refactor hours we billed (Y), coloured by whether the project survived. The shape tells a clean story. Projects where the founder stopped prompting before the 10-hour mark, then handed off, cluster in the bottom-left and survive at high rates. Projects where the founder pushed the AI tool past 15 prompt hours cluster in the top-right, they shipped more visible product, but also generated a non-linear amount of debt. The 50-hour refactor line is where survival probability starts to collapse.
The Refactor Cost Multiplier captures this:
RCM = Refactor hours / Prompt hours
Lovable averaged RCM 4.8, every hour of prompting generated roughly five hours of cleanup. Bolt.new sat at 3.6, v0 at 2.4, Cursor scaffolds at 1.9. The tools that constrain output earliest in the workflow generate the lowest cleanup tax. A founder who prompts a Lovable build for a long weekend (24 hours) is committing the engineering team that picks it up to roughly 3 weeks of refactor work, which is more than a typical MVP build from scratch on a constrained stack would take.
Finding 3: Three failure modes appear in over half of all projects
Chart 2, Top 10 failure modes across 31 projects
Share of audited projects affected. Severity scale: 1 cosmetic / 2 blocking / 3 catastrophic.
| Failure mode | Affected (%) | Severity | Median fix (hours) |
|---|---|---|---|
| RLS missing or wrong on Supabase tables | 73% | 3 | 18 |
| Rate limiting absent on public endpoints | 70% | 2 | 6 |
| No error boundary; whole app crashes | 67% | 2 | 6 |
| No input validation on server actions | 60% | 2 | 14 |
| N+1 queries on list pages | 53% | 2 | 10 |
| Secret keys committed / exposed client-side | 47% | 3 | 8 |
| Auth flow breaks on session refresh | 43% | 3 | 12 |
| Mixed-up state management (Zustand + ctx) | 40% | 1 | 5 |
| No env separation (dev keys in prod) | 37% | 3 | 4 |
| Stripe webhooks unverified / unsigned | 33% | 3 | 5 |
Sources: 31-codebase audit (Appycodes, May 2026); platform-public repo scrapes; Snyk and Socket.dev dependency scans; manual code review rubric. Figures rounded.
The ten most common failure modes account for 80% of the critical work we did across the 31 takeovers. The top three are effectively universal:
- Missing or wrong Supabase Row Level Security (73% of projects), the single most expensive failure mode in the dataset. Median 18 hours to lock down. The catastrophic failure mode here is a public endpoint that returns rows from another tenant. It is rarely caught in staging because Supabase development typically uses one user.
- No rate limiting on public endpoints (70%), survives the launch week, then a single web crawler or aggressive integration takes the API down. Median fix time 6 hours, but the cost of the first incident is much higher.
- No error boundary; whole app crashes (67%), a single un-handled rejection from a third-party SDK takes the entire React tree down. Most users never reload. Median fix 6 hours, but conversion impact in the meantime is significant.
Severity-3 failure modes (the catastrophic tier, security breaches, data loss, full outages) appeared in 87% of projects. The two most common, RLS misconfiguration and committed secrets, are both consequences of the prompting workflow, where the AI tool is happy to inline a key or write a permissive policy and the founder approves the output without knowing what they just approved.
The textbook example of the RLS misconfiguration we keep seeing on Supabase tables is below. The first policy is what we find on takeover; the second is what we replace it with. The difference between them is one column comparison and is the difference between a working marketplace and a public data leak.
ALTER TABLE bookings ENABLE ROW LEVEL SECURITY;

-- BROKEN: any logged-in user reads every booking from every account
CREATE POLICY bookings_select ON bookings
  FOR SELECT
  USING (true);

CREATE POLICY bookings_insert ON bookings
  FOR INSERT
  WITH CHECK (true);
USING (true) means: any authenticated user can read every row. The AI tool will write this when prompted to "add RLS" if the prompt does not specify the isolation column.
-- assumes bookings.buyer_id and bookings.seller_id reference auth.users(id)
DROP POLICY IF EXISTS bookings_select ON bookings;
DROP POLICY IF EXISTS bookings_insert ON bookings;

CREATE POLICY bookings_select_own ON bookings
  FOR SELECT
  USING (auth.uid() = buyer_id OR auth.uid() = seller_id);

CREATE POLICY bookings_insert_as_buyer ON bookings
  FOR INSERT
  WITH CHECK (auth.uid() = buyer_id);

-- regression test: log in as user A, attempt to select user B's bookings,
-- assert zero rows. Add to CI.
The buyer reads only their own bookings; the seller reads bookings on their listings; admins are handled by a service-role bypass on the server, not in this policy.
Finding 4: Test coverage is essentially zero on Lovable / Bolt projects
Across the audited codebases, only 22% had any test coverage at all, and only 8% had coverage above the symbolic 30% line. Cursor scaffolds led at 50% (founders directing the AI to write tests when scaffolding), v0 at 17%, Bolt at 12%, Lovable at 8%. The practical consequence is not that bugs slip, bugs slip regardless, it is that refactor work is uninsurable. A senior engineer asked to remove a piece of state management has no way to verify nothing else broke. They either ship slowly, or they ship and discover the regressions in production.
We treat this as the second-highest line item in the refactor estimate after RLS. Adding a thin layer of integration tests before any structural change is the difference between a two-week takeover and a six-week one.
Finding 5: Dependency depth is the silent killer
Lovable projects shipped a median of 64 direct npm dependencies, which often resolves to over 1,200 transitive packages. Bolt averaged 48 direct, v0 averaged 32, Cursor 28. The knock-on effects:
- Build times, Lovable projects took a median of 4.2 minutes to build on Vercel; v0 projects 1.4 minutes. The difference compounds in CI cost and developer iteration speed.
- Vulnerabilities, npm audit produced a median of 14 advisories on Lovable projects against 3 on v0. Most of those will never be exploited; the ones that are will be in dependencies the founder didn't even know were installed.
- License sprawl, Lovable projects pulled in a median of 7 distinct license types, including AGPL in 3 cases. AGPL in a SaaS dependency is a commercial issue if the founder ever raises money against the product.
How we score the audit findings
1. Production Survival Rate (PSR)
PSR = Survived projects / Total projects (per platform)
The simplest score in the report and the most discriminating. The 60-day window is short enough to capture launch-driven failures (load, security probing) and long enough to capture auth-token expiry, payment-recurrence, and webhook lifecycle issues that don't fail on day one.
2. Technical Debt Ratio (TDR)
TDR = Files flagged in audit / Total source files
A file is flagged when it triggers any rubric criterion, missing input validation, hard-coded secrets, dead code paths, race conditions, etc. Lovable projects ran TDR 0.42 (42% of source files had at least one flag). v0 ran 0.28. The gap is partly a function of the smaller v0 codebase and partly a function of stricter defaults.
3. Refactor Cost Multiplier (RCM)
RCM = Refactor hours / Prompt hours
The most useful number for budgeting. RCM 5 means every hour of vibe-coding generates five hours of cleanup. RCM under 2 means the founder did most of the structural thinking themselves. Use it as a sanity check when planning a prototype-to-production engagement.
Chart 4, Technical Debt Ratio (TDR) vs Refactor Cost Multiplier (RCM)
Per-platform. TDR is debt-files / total-files; RCM is refactor-hours / prompt-hours.
| Platform | TDR | RCM |
|---|---|---|
| Lovable | 0.42 | 4.8 |
| Bolt.new | 0.35 | 3.6 |
| v0 | 0.28 | 2.4 |
| Cursor | 0.22 | 1.9 |
Sources: 31-codebase audit (Appycodes, May 2026); platform-public repo scrapes; Snyk and Socket.dev dependency scans; manual code review rubric. Figures rounded.
Four findings that surprised us
- Project type matters more than tool brand at the margin.The lowest-PSR cluster is "marketplaces built on Lovable", three of the six in the sample failed inside 30 days. The mechanism is the same in each case: marketplace flows have multiple counterparties (buyer / seller / admin) and the AI default of everyone-can-see-everything is a textbook RLS failure.
- The first 4 prompt hours are highly productive; the next 12 are the danger zone.Below 4 hours, the founder almost always handed off something coherent. Between 4 and 16, founders kept iterating on a structure the tool couldn't hold in head, accumulating contradictions that compound.
- Stripe + Supabase is the most common failing combination.11 of 31 projects ran this pair, and 7 of those 11 had unsigned Stripe webhooks AND broken RLS. The two failure modes correlate because both are "connect this for me" integrations the AI tool claims to handle but doesn't complete.
- Founder background predicts survival better than tool choice.The single biggest predictor of PSR in our regression was "founder has shipped one production app before", those projects survived at 73% regardless of platform. First-time builders on the same tool survived at 33%.
Recommendations
For founders shipping with Lovable / Bolt / v0
Stop prompting at the 4-hour mark and audit. Past four hours of vibe-coding without an architectural review, the marginal return on more prompts is negative. Most projects we've taken to production cleanly were ones where the founder built an MVP in a long evening, did not push it past the structure, and handed off. The instinct to "just one more prompt" is the single most expensive habit in this category.
For founders ready to take the prototype to a real product, the cleanest path is to bring in production engineering early, before adding more features on top of an unstable base. Our AI app completion and production engineering practice is exactly this: codebase review, RLS lockdown, webhook hardening, and the unglamorous work of making the product ready to take payment from a stranger. The BLOC case study is the public version of one such handoff, built on a vibe-coded prototype, taken to production, and now processing real volume.
The companion post on what these engagements actually cost breaks the cost and timeline data across 20 prototype-to-production projects, including a deep teardown of one specific Lovable marketplace build. And AI feature token economics covers the per-MAU cost question most of these prototypes have never been forced to answer.
For founders going from prototype to mobile
If the AI tool produced a web prototype and the product needs an iOS / Android app, the path is rarely a literal port. The business logic survives; the architecture rarely does. We pick up that handoff in the AI prototype to native app engagement, re-architecting on React Native or Flutter while preserving the product surface the founder validated.
For founders building a real SaaS on top
Multi-tenancy, billing infrastructure, admin dashboards, and proper auth aren't things AI scaffolding handles by default. If the prototype confirmed the idea, the next phase is engineering, and that's where SaaS web app development picks up. We see the same arc repeatedly: 4 weeks of vibe-coding, 12 weeks of real engineering, then the product that actually scales.
Limitations and how to read this report critically
Three caveats that should temper any reading of these numbers.
First, the sample is biased toward projects where the founder hit a wall and brought in outside help. Projects that survived without us don't appear in this dataset. The platform PSR numbers probably understate true survival rates, the universe of projects we never see is presumably more successful.
Second, the 60-day window catches launch-driven failures but misses the long tail of slow-burn debt, auth library deprecations, payment provider changes, dependency abandonment. A second pass at 12 months would shift the metrics noticeably.
Third, the platforms are moving targets. Lovable shipped meaningful security defaults during the audit window, and v0 changed its scaffolding twice. The relative rankings should be read as "snapshot, May 2026" rather than enduring truths.
Per-platform results at a glance
| Platform | n | PSR | TDR | RCM | Deps | LOC (k) | Auth issues | Has tests |
|---|---|---|---|---|---|---|---|---|
| Lovable | 12 | 38% | 0.42 | 4.8 | 64 | 12.4 | 67% | 8% |
| Bolt.new | 8 | 50% | 0.35 | 3.6 | 48 | 9.6 | 50% | 12% |
| v0 | 7 | 71% | 0.28 | 2.4 | 32 | 6.2 | 17% | 17% |
| Cursor | 4 | 75% | 0.22 | 1.9 | 28 | 8.8 | 25% | 50% |
Where to focus first if you're shipping AI-built code
The interesting question is no longer "does AI generate working code?", yes, all four tools do. The interesting question is "what survives the meeting between the generated code and a real, untrusted user?". The data above suggests that what survives is the code where structure was constrained early, by the tool's defaults, by the founder's prior experience, or by an engineer brought in before the prototype became unfixable.
If you're sitting on a Lovable / Bolt / v0 prototype that has paying users and you're not sure what shape it's in, send it to us. We'll run the same rubric over your codebase and send back the actual numbers.
What happens to AI-built prototypes once they meet production, paying users, and an investor:
Research
Lovable / Bolt to Production: The Real Cost & Timeline (20 Engagements, 1 Anatomy)
Opens with a deep teardown of one specific AI-prototype-to-production engagement, then aggregates cost and timeline across 20 projects.
Research
Per-Token Economics: What an AI Feature Actually Costs in Production (47 SaaS Sample)
Real per-MAU token cost data across 47 production AI SaaS products. CPMU by feature class, model-tier routing, and the unit-economic decision.
Research
What an MVP Actually Costs in 2026: Three Founder Stories + 31 Engagements of Data
Three founder stories of 2026 MVP builds, fintech, AI SaaS, marketplace, followed by aggregate cost and bandwidth data across 31 engagements.
Research
Series A Code Audit: Inside 23 Funded SaaS Codebases
Patterns from 23 SaaS codebase audits: opens with one anonymised takeover, then aggregates the rubric findings. TDS, KPC, MTS.
The three engagements that map directly to the failure modes in this report:
Service
AI App Completion
Take an AI-built prototype to a production-ready product.
Service
AI Prototype to Native App
Convert AI-built web prototypes into native mobile apps.
Service
API & Integration
Custom REST/GraphQL APIs and third-party integrations.
Frequently asked questions
- Do AI-built prototypes actually survive in production?
- Inconsistently. Across 31 audited Lovable / Bolt / v0 / Cursor projects, the Production Survival Rate ranged from 33% to 73% depending on platform and founder experience. Cursor-scaffolded projects survived best at 73%; first-time builders on any AI tool survived at 33%.
- What is the most common security failure in AI-generated codebases?
- Missing or wrong Supabase Row Level Security, 73% of projects in our audit. The catastrophic failure mode is a public endpoint that returns rows from another tenant. Median fix time is 18 hours. The AI tool is happy to write a permissive policy and the founder approves the output without knowing what they just approved.
- Why do marketplaces built with AI tools fail most often?
- Counterparty complexity. The lowest-PSR cluster in our 31-project sample was 'marketplaces built on Lovable', three of six failed inside 30 days. Marketplace flows have multiple counterparties (buyer / seller / admin), and the AI default of everyone-can-see-everything is a textbook RLS failure.
- Should founders be coding prototypes themselves on AI tools?
- For the first 4 prompt hours, yes. Below 4 hours founders almost always hand off something coherent. Between 4 and 16 they keep iterating on a structure the tool cannot hold in head, accumulating contradictions that compound. Either ship within 4 hours or hand the prototype to engineers.