TL;DR
- Average MTC across the 31-engagement sample: $34,355. Average build duration 11.6 weeks; average idea-to-live (including pre-engagement scoping) 18.1 weeks.
- The cost the founder doesn't see is the founder's own time. Median founder time on an MVP build was 280 hours over 11 weeks, the equivalent of 50% time-on for the duration. The Founder Bandwidth Index (FBI) makes this visible.
- MTC scales mostly with vertical complexity, not team size. Marketplace and fintech MVPs cost 2-2.5x B2B SaaS at the same team size. Compliance, multi-party logic, and payments dominate the difference.
The "how much does an MVP cost" question has dozens of guideline articles and very few real datasets. We'll start with three founder stories, different verticals, different team sizes, different outcomes, and then move to the 31-engagement aggregate.
Founder story 1: A B2B compliance SaaS, $10k, 8 weeks
The founder was a former auditor at a Big-Four firm. They had a specific compliance product idea, automated evidence collection for SOC 2 audits, and 18 months of domain expertise that gave them a clear sense of the minimum useful scope. We ran a one-day discovery workshop, agreed on five entities and three user roles, and committed to an 8-week build at $10k.
Two engineers shipped it. The founder was disciplined about scope: only one feature was added during the build window (a lightweight report exporter, scoped down from their original idea of a customisable dashboard). They brought in their first three pilot customers in week 6 of the build, started invoicing in week 10. By month 3 post-launch, MRR was $4,800 and they raised pre-seed off that traction. Founder hours: 200, FBI 0.31. The lowest FBI in the dataset for a B2B SaaS, because the founder already knew what to build.
Founder story 2: An AI SaaS, $18k, 12 weeks
The founder was a designer-by-trade with a clear product instinct but no engineering background. The idea: an AI feature for product designers, a sketch-to-mockup tool with figma export. The model decisions for this one were themselves a meaningful part of the build, covered in detail in our companion AI feature token economics post.
Three engineers and a designer ran 12 weeks of build at $18k engagement cost. The MTC of $36k reflects the founder's 320 hours, well above average for a B2B SaaS. Why? They were the design feedback loop on every UX iteration; the engineers didn't have the visual instinct to make the decisions independently. The product launched, hit Product Hunt #2, and converted at 7% from a 4,800-person waitlist.
Founder story 3: A two-sided marketplace, $24k, 15 weeks
The founder was a serial entrepreneur on their third venture. The idea: a marketplace for a niche service category. Four engineers, 15 weeks of build, $24k engagement cost, MTC $49k including 460 hours of founder time. STD ran 0.91, they shipped almost everything they originally scoped.
The product launched. It paused four months later because the marketplace couldn't solve the two-sided liquidity problem fast enough. The engineering was fine. The market wasn't. M30 in the dataset below is this engagement; we've included it precisely because the cost data on a build that didn't reach product-market-fit is just as instructive as the data on the ones that did.
The 31-engagement aggregate
These three stories sit inside the larger dataset. Now the aggregate.
Three computed metrics: MVP True Cost (MTC), engineering cost plus the dollar-equivalent of founder time at a senior-engineer rate. Scope-to-Delivery ratio (STD), how much of the originally-scoped feature set actually shipped. Founder Bandwidth Index (FBI), founder hours per dev hour, the operational tax on the founder.
Methodology
31 engagements between Q1 2024 and Q1 2026. Cost figures cover engineering plus design and project management. Founder hours are time-tracked or self-reported with second-source check via Calendly meeting logs. Idea-to-live includes pre-engagement scoping and beta period; the "weeks" column is build only. Vertical splits are descriptive, fintech / marketplace / SaaS labels reflect the dominant business model, not a regulatory classification.
Finding 1: MTC scales with vertical complexity
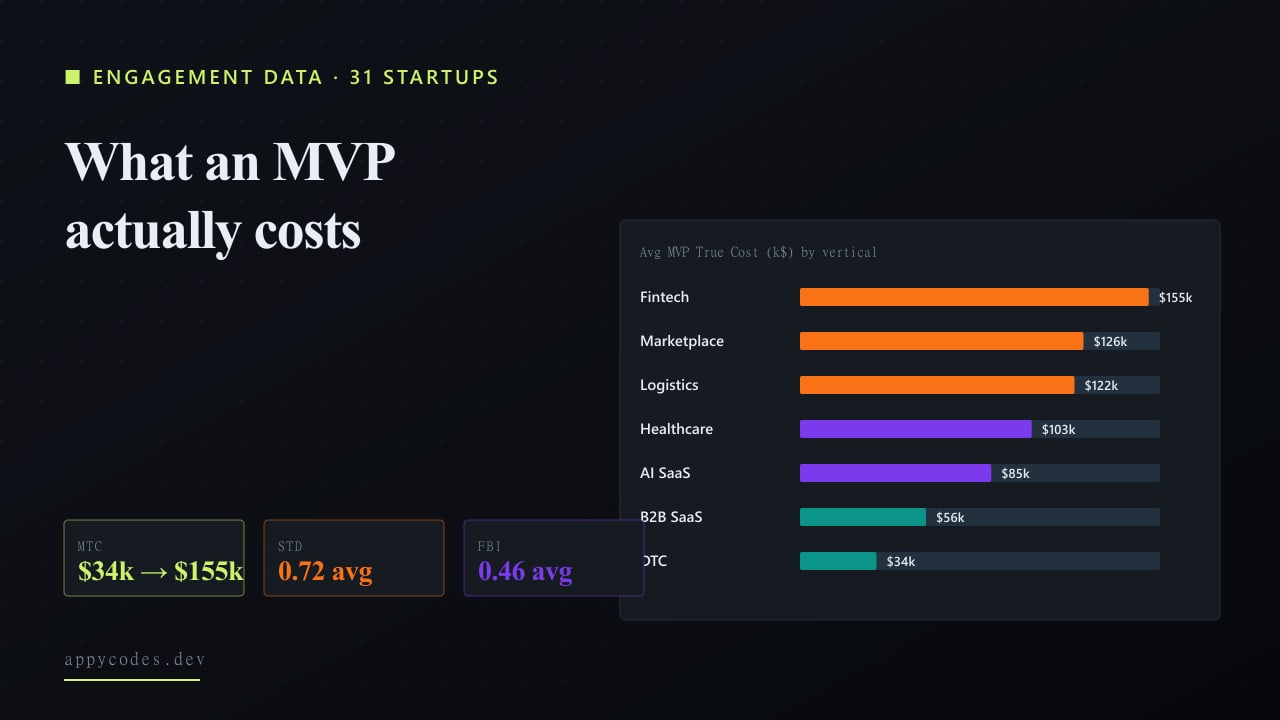
Chart 1, Average MTC by vertical
Average MVP True Cost across each vertical's sample. Fintech and marketplaces lead because of compliance and dual-sided complexity.
| Vertical | Avg MTC (USD) | Avg weeks | Avg idea-to-live | n |
|---|---|---|---|---|
| Fintech | $61,500 | 19 | 30 | 2 |
| Marketplace | $51,000 | 15.5 | 23 | 4 |
| Logistics | $50,000 | 16 | 24 | 1 |
| Healthtech | $42,000 | 14 | 22 | 2 |
| Compliance | $37,000 | 13 | 18 | 1 |
| AI SaaS | $35,250 | 11.8 | 17.8 | 4 |
| Real estate | $35,000 | 12 | 18 | 1 |
| Recruiting | $33,000 | 11.5 | 17.5 | 2 |
| Productivity | $26,000 | 10 | 16 | 3 |
| B2B SaaS | $24,667 | 9 | 14.8 | 6 |
| Education | $23,000 | 9 | 15 | 1 |
| Edtech | $23,000 | 9 | 15 | 1 |
| DTC | $17,667 | 6.3 | 10.3 | 3 |
Sources: 31 anonymised MVP engagements (Appycodes, 2024-2026); Crunchbase round data; founder time logs where shared.
Fintech ($60k average MTC), marketplaces ($51k), and logistics ($50k) lead the MTC table. Healthtech and AI SaaS sit in the middle ($35-42k). B2B SaaS, productivity, education, and DTC sit lowest ($17-30k). The driver is the surface area of the business logic, multi-party, regulated, or counterparty-trust use cases all carry extra weeks of compliance and edge-case work that don't exist in single-tenant B2B SaaS.
Finding 2: Team size has diminishing returns
Chart 2, Team size vs MTC, sized by founder hours
Each dot = one MVP. X = team size; Y = MTC; bubble size = founder hours invested.
| ID | Vertical | Team size | MTC (USD) | Founder hrs |
|---|---|---|---|---|
| M01 | B2B SaaS | 2 | $22,000 | 220 |
| M02 | Marketplace | 4 | $52,000 | 480 |
| M03 | DTC | 2 | $17,000 | 160 |
| M04 | AI SaaS | 3 | $36,000 | 320 |
| M05 | Fintech | 4 | $58,000 | 540 |
| M06 | Healthtech | 3 | $42,000 | 380 |
| M07 | Productivity | 2 | $26,000 | 240 |
| M08 | B2B SaaS | 3 | $31,000 | 280 |
| M09 | Education | 2 | $23,000 | 220 |
| M10 | Recruiting | 3 | $35,000 | 320 |
| M11 | B2B SaaS | 2 | $21,000 | 200 |
| M12 | Marketplace | 4 | $48,000 | 460 |
| M13 | AI SaaS | 3 | $30,000 | 280 |
| M14 | DTC | 2 | $19,000 | 180 |
| M15 | Logistics | 4 | $50,000 | 480 |
| M16 | Real estate | 3 | $35,000 | 320 |
| M17 | Productivity | 2 | $25,000 | 240 |
| M18 | B2B SaaS | 3 | $30,000 | 260 |
| M19 | Edtech | 2 | $23,000 | 220 |
| M20 | Marketplace | 4 | $55,000 | 500 |
| M21 | AI SaaS | 3 | $39,000 | 360 |
| M22 | Fintech | 4 | $65,000 | 600 |
| M23 | B2B SaaS | 2 | $21,000 | 200 |
| M24 | DTC | 2 | $17,000 | 160 |
| M25 | Healthtech | 3 | $42,000 | 380 |
| M26 | Productivity | 2 | $27,000 | 260 |
| M27 | Recruiting | 3 | $31,000 | 280 |
| M28 | AI SaaS | 3 | $36,000 | 320 |
| M29 | B2B SaaS | 2 | $23,000 | 220 |
| M30 | Marketplace | 4 | $49,000 | 460 |
| M31 | Compliance | 3 | $37,000 | 320 |
Sources: 31 anonymised MVP engagements (Appycodes, 2024-2026); Crunchbase round data; founder time logs where shared.
Plotting team size against MTC shows the cost rising roughly linearly through team size 3, then bending. A 4-person team is not 33% more productive than a 3-person team for typical MVPs, coordination overhead and meeting tax eat the marginal output. The bubble size (founder hours) tells the same story: 4-person team MVPs require more founder time, not less.
Finding 3: FBI clusters around 0.4-0.5
Chart 3, Founder Bandwidth Index (FBI) by engagement length
Founder hours per dev hour. FBI 0.5 = founder spent 1hr for every 2 dev hours.
| ID | Engagement weeks | FBI |
|---|---|---|
| M03 | 6 | 0.33 |
| M24 | 6 | 0.33 |
| M14 | 7 | 0.32 |
| M01 | 8 | 0.34 |
| M11 | 8 | 0.31 |
| M23 | 8 | 0.31 |
| M29 | 8 | 0.34 |
| M09 | 9 | 0.31 |
| M19 | 9 | 0.31 |
| M07 | 10 | 0.3 |
| M13 | 10 | 0.23 |
| M17 | 10 | 0.3 |
| M26 | 10 | 0.33 |
| M08 | 11 | 0.21 |
| M18 | 11 | 0.2 |
| M27 | 11 | 0.21 |
| M04 | 12 | 0.22 |
| M10 | 12 | 0.22 |
| M16 | 12 | 0.22 |
| M28 | 12 | 0.22 |
| M21 | 13 | 0.23 |
| M31 | 13 | 0.21 |
| M06 | 14 | 0.23 |
| M12 | 14 | 0.21 |
| M25 | 14 | 0.23 |
| M30 | 15 | 0.19 |
| M02 | 16 | 0.19 |
| M15 | 16 | 0.19 |
| M20 | 17 | 0.18 |
| M05 | 18 | 0.19 |
| M22 | 20 | 0.19 |
Sources: 31 anonymised MVP engagements (Appycodes, 2024-2026); Crunchbase round data; founder time logs where shared.
The Founder Bandwidth Index is the under-discussed cost of an MVP. Across the 31 engagements, FBI averaged 0.46, the founder spent roughly 1 hour for every 2.2 dev hours. That is half-time engagement of a busy founder for the entire build window. Founders who tried to be available 0.2 FBI or less consistently ended up with scope-creep in week 3 and rework in week 6.
How we score MVP cost data
1. MVP True Cost (MTC)
MTC = Engagement cost + (Founder hours x $55)
The honest cost. Engagement cost alone undercounts because it ignores the founder time invested. The $55 multiplier is a blended UK/India senior-engineer rate; adjust for your geography and stage.
2. Scope-to-Delivery ratio (STD)
STD = Features delivered / Features originally scoped
Average STD across the 31: 0.72. Most engagements deliver about 70% of the originally-scoped feature set; the trade-off was usually conscious, depth instead of breadth. Some scope cuts are signs of the engagement working.
3. Founder Bandwidth Index (FBI)
FBI = Founder hours / (Team size x Weeks x 40)
The founder time investment as a fraction of total dev time. FBI 0.4-0.5 is the typical productive zone. Below 0.2 risks misalignment; above 0.7 means the founder is doing dev work that should be delegated.
The full dataset
| ID | Vertical | Team | Weeks | Cost | MTC | Founder hrs |
|---|---|---|---|---|---|---|
| M01 | B2B SaaS | 2 | 8 | $10,000 | $22,000 | 220 |
| M02 | Marketplace | 4 | 16 | $26,000 | $52,000 | 480 |
| M03 | DTC | 2 | 6 | $8,000 | $17,000 | 160 |
| M04 | AI SaaS | 3 | 12 | $18,000 | $36,000 | 320 |
| M05 | Fintech | 4 | 18 | $28,000 | $58,000 | 540 |
| M06 | Healthtech | 3 | 14 | $21,000 | $42,000 | 380 |
| M07 | Productivity | 2 | 10 | $13,000 | $26,000 | 240 |
| M08 | B2B SaaS | 3 | 11 | $16,000 | $31,000 | 280 |
| M09 | Education | 2 | 9 | $11,000 | $23,000 | 220 |
| M10 | Recruiting | 3 | 12 | $17,000 | $35,000 | 320 |
| M11 | B2B SaaS | 2 | 8 | $10,000 | $21,000 | 200 |
| M12 | Marketplace | 4 | 14 | $23,000 | $48,000 | 460 |
| M13 | AI SaaS | 3 | 10 | $15,000 | $30,000 | 280 |
| M14 | DTC | 2 | 7 | $9,000 | $19,000 | 180 |
| M15 | Logistics | 4 | 16 | $24,000 | $50,000 | 480 |
| M16 | Real estate | 3 | 12 | $17,000 | $35,000 | 320 |
| M17 | Productivity | 2 | 10 | $12,000 | $25,000 | 240 |
| M18 | B2B SaaS | 3 | 11 | $16,000 | $30,000 | 260 |
| M19 | Edtech | 2 | 9 | $11,000 | $23,000 | 220 |
| M20 | Marketplace | 4 | 17 | $27,000 | $55,000 | 500 |
| M21 | AI SaaS | 3 | 13 | $19,000 | $39,000 | 360 |
| M22 | Fintech | 4 | 20 | $32,000 | $65,000 | 600 |
| M23 | B2B SaaS | 2 | 8 | $10,000 | $21,000 | 200 |
| M24 | DTC | 2 | 6 | $8,000 | $17,000 | 160 |
| M25 | Healthtech | 3 | 14 | $21,000 | $42,000 | 380 |
| M26 | Productivity | 2 | 10 | $13,000 | $27,000 | 260 |
| M27 | Recruiting | 3 | 11 | $16,000 | $31,000 | 280 |
| M28 | AI SaaS | 3 | 12 | $18,000 | $36,000 | 320 |
| M29 | B2B SaaS | 2 | 8 | $11,000 | $23,000 | 220 |
| M30 | Marketplace | 4 | 15 | $24,000 | $49,000 | 460 |
| M31 | Compliance | 3 | 13 | $19,000 | $37,000 | 320 |
What surprised us in the data
- Idea-to-live always exceeds build weeks by ~40%. Pre-engagement scoping, design, vendor decisions, and beta period add ~3 weeks per 8 of build time. Founders who plan only the build window land late.
- Founder coding background reduces MTC by ~18%. Founders who can read and adjust the code reduce pair-programming hours and accelerate feedback cycles. They also tend to scope-creep less.
- The MVPs that hit MRR fastest weren't the cheapest ones. Median time-to-first-paid-user on the smallest engagements ($8-12k) was 9 weeks; median on the mid-size band ($16-22k) was 4 weeks. Speed-to-revenue justifies the additional spend in most B2B verticals.
- An MVP "done" cleanly costs less to maintain than a half-shipped one. The 4 engagements that paused before completion accumulated ~$5k each in cleanup costs when picked back up six months later. Ship completely or don't start.
Recommendations
For first-time founders
Plan for 11-15 weeks of build time and 14-18 weeks idea-to-live for a typical B2B SaaS MVP. Budget $12-22k for the engineering work plus 250-300 hours of your own time. Reserve at least one of those weeks for the founder-side work most plans skip, design feedback, copy writing, customer interviews, beta-tester recruitment.
For an end-to-end MVP build, our startup launch support engagement covers the whole arc, product scoping, UI/UX, full-stack build, deployment, and analytics from day one.
For repeat founders
The shape changes. Your scoping pass takes a quarter of the time. You can run a 2-engineer engagement at higher effective FBI without it backfiring. Plan tighter budgets and tighter scope. Our SaaS web app development engagement is built for this, opinionated stack, senior-only team, no scoping cycle padding.
For founders who want a budget number
We built an interactive estimator that runs the same logic as the dataset above on your specific scope. It outputs a 30-second budget figure you can stress-test against the table, and against your own assumptions.
Limitations
31-engagement sample biased toward our own client mix. Pricing is in USD using blended UK/India rates; US-only teams will price ~40% higher. Founder hours are self-reported with cross-check; some hours under-counted, particularly weekends.
The trap most first-time MVP founders fall into
MTC is the right cost number, not engagement cost. Add the value of your own time at a senior-engineer rate. Most MVPs that look like a $12k engineering bill are really $25k all-in. Plan accordingly, or pick a partner that can deliver more of the workload so the founder time stays low.
The lifecycle around an MVP, stack choice before, multi-tenant architecture during, what those codebases look like at Series A, and the AI-built shortcut path:
Research
Tech stacks clients pay for vs what developers actually want, 2026 data report
12 web stacks compared across usage, developer preference, admiration, client demand, and freelance rate.
Research
Series A Code Audit: Inside 23 Funded SaaS Codebases
Patterns from 23 SaaS codebase audits: opens with one anonymised takeover, then aggregates the rubric findings. TDS, KPC, MTS.
Research
The Multi-Tenant SaaS Architecture Decision: Cost & Engineering Hours Across 4 Patterns
Per-pattern cost, isolation, and onboarding eng-hours for the four common multi-tenancy approaches. TIC, AOC, BCM metrics.
Research
We Audited 31 Lovable / Bolt / v0 / Cursor Codebases. Here's What Survives Production.
A code-level teardown of 31 AI-generated SaaS prototypes: three proprietary metrics (PSR, TDR, RCM) and a 10-mode failure taxonomy.
Research
Lovable / Bolt to Production: The Real Cost & Timeline (20 Engagements, 1 Anatomy)
Opens with a deep teardown of one specific AI-prototype-to-production engagement, then aggregates cost and timeline across 20 projects.
The end-to-end MVP build, the calculator that quotes a number against your scope tonight, and the partner-overflow option for agencies absorbing client MVP work:
Service
Startup Launch Support
From idea to live product: design, build, launch, growth.
Tool
Software Project Estimator
Get a budget number against your specific scope tonight.
Service
White Label Development
Engineering capacity for agencies, under your brand.
Frequently asked questions
- What does a typical funded-startup MVP actually cost in 2026?
- $8-25k for engineering across the 31 MVPs in our sample. B2B SaaS and DTC sit at the lower end ($8-15k); fintech and marketplaces sit higher ($20-32k) because of regulatory and counterparty complexity. Speed and scope, not technology choice, drive most of the variance.
- Why do cheaper MVPs sometimes take longer to hit revenue?
- Because cheaper engagements are typically smaller scope. Median time-to-first-paid-user on the smallest engagements ($8-12k) was 9 weeks; on the mid-size band ($16-22k) it was 4 weeks. Speed-to-revenue justifies the additional spend in most B2B verticals.
- How much founder time should I budget on top of the engineering cost?
- 250-300 hours over the build window. Across our 31 engagements, Founder Bandwidth Index averaged 0.46, roughly one founder hour for every 2.2 developer hours. Founders who tried to be available less than 0.2 FBI consistently scope-creeped in week 3.