TL;DR
- WordPress has the largest market-driven gap of any stack we measured, client demand is roughly 12x developer preference. People are paid to maintain it; very few choose it for personal projects.
- Svelte, Solid, and Astro top the "passion stack" list, high admiration and high desire, but their share of paid client work is in single digits. If you build a career on them today you optimise for happiness, not income.
- React and Node.js are the highest-monetisable stacks by SMS score, not the highest-paid per hour, but the deepest paying market. Premium-rate stacks like Solid and Svelte have nowhere to spend the rate.
Every twelve months a new round of "most-loved framework" surveys come out. Every twelve months a different round of job-board reports follow, often telling a completely different story. The two never meet on the same chart. This report puts them on the same chart.
We pulled data from five categories of source, developer surveys, real-world technology usage on the live web, hiring demand signals, freelance rates, and senior developer salaries, across a curated set of 12 web stacks. From those raw figures we computed four original metrics: the Demand-Preference Gap Index (DPGI), the Stack Monetisation Score (SMS), the Hype vs Reality Ratio (HRR), and the Legacy Lock-in Score. The metrics, the formulas, and the dataset are all included below, you can re-derive everything if you disagree with our reading.
The intent is not to crown a winner. It is to make the trade-offs explicit so freelancers, agency leads, and founders can make actual decisions.
Methodology and data sources
The five raw fields per stack:
- Used %, share of all developers in the Stack Overflow Developer Survey (2024 + 2025) who report using the technology professionally.
- Wanted %, share of all developers who say they want to use the technology in the next year (Stack Overflow "Desired").
- Admired %, of current users, share who want to keep using it (Stack Overflow "Admired").
- Demand %, synthesised share of new web client work where the stack is requested. Derived from W3Techs site-share data, public job-board frequency analyses (LinkedIn, Indeed), agency portfolio listings on Clutch, and freelance category share on Upwork. Where sources disagreed we took a midpoint.
- Avg $/hr, blended senior freelance/contractor rate (USD), drawing on Toptal published ranges, public Upwork bid data, and Glassdoor senior-salary conversions.
All figures are rounded estimates. Where we are quoting a published number directly, the source is named. Where we are synthesising across sources (especially Demand % and hourly rate) the figure represents a defensible midpoint, not a precise reading. The full dataset is below the analysis, verify before quoting.
The dataset (all 12 stacks)
| Stack | Used % | Wanted % | Admired % | Demand % | $/hr |
|---|---|---|---|---|---|
| React | 40 | 31 | 65 | 50 | $80 |
| Next.js | 17 | 24 | 80 | 35 | $90 |
| Vue | 16 | 16 | 64 | 18 | $70 |
| Angular | 17 | 8 | 47 | 25 | $75 |
| Svelte | 6 | 18 | 73 | 5 | $95 |
| Solid | 2 | 7 | 80 | 1 | $100 |
| Astro | 6 | 14 | 78 | 4 | $85 |
| WordPress | 17 | 5 | 32 | 60 | $50 |
| Shopify | 5 | 6 | 50 | 20 | $70 |
| Laravel | 7 | 7 | 60 | 12 | $55 |
| Django | 12 | 13 | 64 | 14 | $70 |
| Node.js | 41 | 24 | 67 | 50 | $80 |
Chart 1, Developer preference vs Client demand
X = Wanted % (devs who want to use it). Y = Demand % (clients hiring for it). Each dot = a stack.
| Stack | Category | Wanted % (X) | Demand % (Y) |
|---|---|---|---|
| React | frontend | 31 | 50 |
| Next.js | frontend | 24 | 35 |
| Vue | frontend | 16 | 18 |
| Angular | frontend | 8 | 25 |
| Svelte | frontend | 18 | 5 |
| Solid | frontend | 7 | 1 |
| Astro | frontend | 14 | 4 |
| WordPress | cms | 5 | 60 |
| Shopify | cms | 6 | 20 |
| Laravel | backend | 7 | 12 |
| Django | backend | 13 | 14 |
| Node.js | backend | 24 | 50 |
Sources: Stack Overflow Developer Survey 2024 to 25; State of JS 2024; W3Techs; blended salary data from Glassdoor + Toptal. Figures rounded.
The first plot already tells most of the story. The dots cluster into three distinct regions. WordPress sits alone in the bottom-right: client demand near 60%, developer preference at 5%. Svelte, Solid, Astro and Next.js cluster in the top-left to centre: developer enthusiasm well above where client work matches it. React and Node.js anchor the top-right: high on both axes, "necessary defaults" in the modern web stack.
The most under-discussed reality on this chart is Angular. Stack Overflow data consistently shows Angular among the lower-admired major frameworks, its desired percentage runs in the single digits. Yet enterprise demand keeps it firmly in the 20 to 25% range of new client work. That gap is the structural force behind what we call the Demand-Preference Gap Index.
Two SEO realities sit just below this chart for the React / Next.js / Angular cluster: rendering strategy and update shipping. The JavaScript SEO study measures how render-dependent indexability behaves across the same frameworks at funded-SaaS scale, and is the easiest companion read for anyone choosing a stack on this chart for a marketing surface. React Native sits in the dataset too, the App Store rejection data and OTA updates study cover the two operational costs that the hourly-rate column above does not capture: how often submissions get rejected, and what shipping fixes actually costs in production.
How we score each stack
From the five raw fields above we derive four scores:
1. Demand-Preference Gap Index (DPGI)
DPGI = Demand % - Wanted %
Positive scores mean the market pulls you toward the stack faster than developers would choose it on their own. Negative scores mean developers love it more than clients pay for it. Zero is alignment between what gets built professionally and what engineers reach for in side projects.
2. Stack Monetisation Score (SMS)
SMS = Avg $/hr x Demand % / 100
An effective-leverage figure. It answers a real question for freelancers and consultants: of the stacks I could specialise in, which one combines a respectable hourly rate with enough work to actually fill a calendar? A high SMS means both the rate and the volume are there. A low SMS means either the rate is decent but the volume is thin (Solid, Svelte) or the volume is high but the rate is depressed (WordPress at the lower end).
3. Hype vs Reality Ratio (HRR)
HRR = Wanted % / Used %
Above 1 the stack is overhyped relative to its real-world adoption, admired in theory, deployed less in practice. Below 1 the stack has more real users than people who actively want to use it, a sign of an established default, sometimes a sign of inertia. Right at 1 means the talk and the action match.
4. Legacy Lock-in Score
Lock-in = Used % x (100 - Admired %) / 100
An estimate of the share of all developers using a stack who would rather not be. High scores indicate platform inertia: large numbers of people maintaining code they have no enthusiasm for. The brief's original formulation was "Used minus Admired"; we adjusted because the two figures sit on different bases (Used is over all devs, Admired is over current users), and the multiplied form gives a defensible single-axis score.
Chart 2, Demand-Preference Gap Index (DPGI)
Demand % minus Wanted %. Positive = market forces it; negative = devs love it but clients don't pay for it. Sorted high to low.
| Stack | DPGI (percentage points) |
|---|---|
| WordPress | +55 |
| Node.js | +26 |
| React | +19 |
| Angular | +17 |
| Shopify | +14 |
| Next.js | +11 |
| Laravel | +5 |
| Vue | +2 |
| Django | +1 |
| Solid | -6 |
| Astro | -10 |
| Svelte | -13 |
Sources: Stack Overflow Developer Survey 2024 to 25; State of JS 2024; W3Techs; blended salary data from Glassdoor + Toptal. Figures rounded.
The DPGI ranking puts the gap between WordPress and Solid at over 70 percentage points. WordPress: +55 (clients want it 55 points more than devs do). Svelte: -13. The shape of this chart is the shape of the web economy. The technologies with the strongest positive DPGI scores, WordPress, Node.js, Angular, React, are precisely the ones that fund full-time engineering teams, whether or not the engineers on those teams would have chosen them in a vacuum.
The negative-DPGI cluster (Svelte, Astro, Solid) is the "passion stack" tier. Real, productive people work in these stacks every day. They are also fundamentally not a market opportunity yet, at least, not for client services. Building product on these stacks is a different question. Hiring an agency to build in Svelte today is paying a premium for scarcity.
The monetisation question
SMS reframes the "which stack pays best" question. Highest hourly rate alone is misleading because thin demand caps the income ceiling regardless of your day rate. A $100/hr Solid specialist who finds three weeks of qualified work a year earns less than an $80/hr React generalist with a full pipeline.
The top SMS scores in our dataset:
- React, SMS 40 ($80/hr x 50% demand)
- Node.js, SMS 40 ($80/hr x 50% demand)
- Next.js, SMS 32 ($90/hr x 35% demand)
- WordPress, SMS 30 ($50/hr x 60% demand)
- Angular, SMS 19 ($75/hr x 25% demand)
- Shopify, SMS 14 ($70/hr x 20% demand)
Three observations stand out. First, React and Node.js tie at the top not because of premium rates but because both axes are genuinely large. Either is a defensible commercial specialisation today, most of our own SaaS web app development work runs on this stack precisely because the talent depth and the demand depth match. Second, WordPress lands third in raw monetisation despite having the lowest hourly rate in the set, the demand share is so dominant that a moderate rate x very high volume still compounds. Third, Svelte / Solid / Astro are nowhere near the top. The premium hourly rate quoted in scarcity-driven freelance listings does not translate into meaningful annual income because the hours never accumulate.
Chart 3, Demand vs Salary, sized by Usage
X = Demand %. Y = Avg hourly rate (USD). Bubble size = Used %. Top-right + big = highest leverage.
| Stack | Category | Demand % (X) | Avg $/hr (Y) | Used % (bubble size) |
|---|---|---|---|---|
| React | frontend | 50 | $80 | 40 |
| Next.js | frontend | 35 | $90 | 17 |
| Vue | frontend | 18 | $70 | 16 |
| Angular | frontend | 25 | $75 | 17 |
| Svelte | frontend | 5 | $95 | 6 |
| Solid | frontend | 1 | $100 | 2 |
| Astro | frontend | 4 | $85 | 6 |
| WordPress | cms | 60 | $50 | 17 |
| Shopify | cms | 20 | $70 | 5 |
| Laravel | backend | 12 | $55 | 7 |
| Django | backend | 14 | $70 | 12 |
| Node.js | backend | 50 | $80 | 41 |
Sources: Stack Overflow Developer Survey 2024 to 25; State of JS 2024; W3Techs; blended salary data from Glassdoor + Toptal. Figures rounded.
Reading the bubble chart: the top-right is high demand and high rate; the bottom-left is the inverse. Bubble size is overall developer usage. The bubbles that matter most for income are the ones that are both large (broad usage means you can find the next gig) and far right (strong demand signal). React and Node.js dominate by both criteria. Next.js sits at a higher hourly rate but smaller share. WordPress is middle on rate, dominant on demand, and has the second-largest bubble.
The lonely small bubbles in the upper-left, Solid at $100/hr, Svelte at $95/hr, are statistically real but practically marginal. They exist as a price signal, not a market.
Hype vs reality, ranked
HRR identifies which technologies have a discourse problem.
At the top of the overhyped list is Solid (HRR ≈ 3.5), wanted three and a half times more than it is used. Astro (HRR ≈ 2.3) follows the same pattern: thoughtful technical content has built genuine interest, but actual deployments lag the conversation by years. Svelte at HRR 3.0 has been in this position for nearly a decade now; the gap between the framework's admirers and its production users is one of the longest-running stories in front-end engineering.
At the underhyped end, WordPress (HRR ≈ 0.3) and Angular (HRR ≈ 0.5) are the clearest cases of platforms with more users than fans. Both share a similar shape, older codebases, established enterprise footprints, business reasons to stay even when developer preference would migrate elsewhere.
The instructive case is React itself, sitting at HRR ≈ 0.8. This is the first year in our memory where React's wanted percentage falls measurably below its used percentage. It is too early to call this a shift, React is still the majority front-end choice in active client work, but the curve is bending. The wanted/used ratio is the leading indicator that catches these inflections years before market share moves.
The Legacy Lock-in tier
Legacy Lock-in is not a moral judgement. Some lock-in is rational: a platform that powers a third of the public web is going to keep being maintained whether or not its maintainers love the work. Lock-in becomes interesting when the gap between usage and admiration is large enough that the maintenance cost shows up elsewhere, recruiting friction, slower iteration, accidental rewrites.
The top of the lock-in list:
- React, Lock-in 14 (40% used x 35% not admired)
- Node.js, Lock-in 13.53 (41% used x 33% not admired)
- WordPress, Lock-in 11.56 (17% used x 68% not admired)
- Angular, Lock-in 9.01 (17% used x 53% not admired)
- Vue, Lock-in 5.76 (16% used x 36% not admired)
React and Node.js show high lock-in scores in raw terms because the usage base is so large. That is misleading on its own, both still post Admired percentages above 60%, which means most of their users would choose them again. The more interesting reading is the ratio: WordPress's admired rate at 32% combined with its 17% usage means roughly two-thirds of WordPress developers would not recommend the platform to their younger self. That is a structural recruiting problem the WordPress ecosystem has lived with for a decade.
Angular shows a similar but milder version of the same pattern. Used by 17% of developers, admired by under half. The Angular maintainership has done meaningful work in recent years, signals, standalone components, the migration tooling, but the perception lags the engineering. Lock-in is partly real and partly historical.
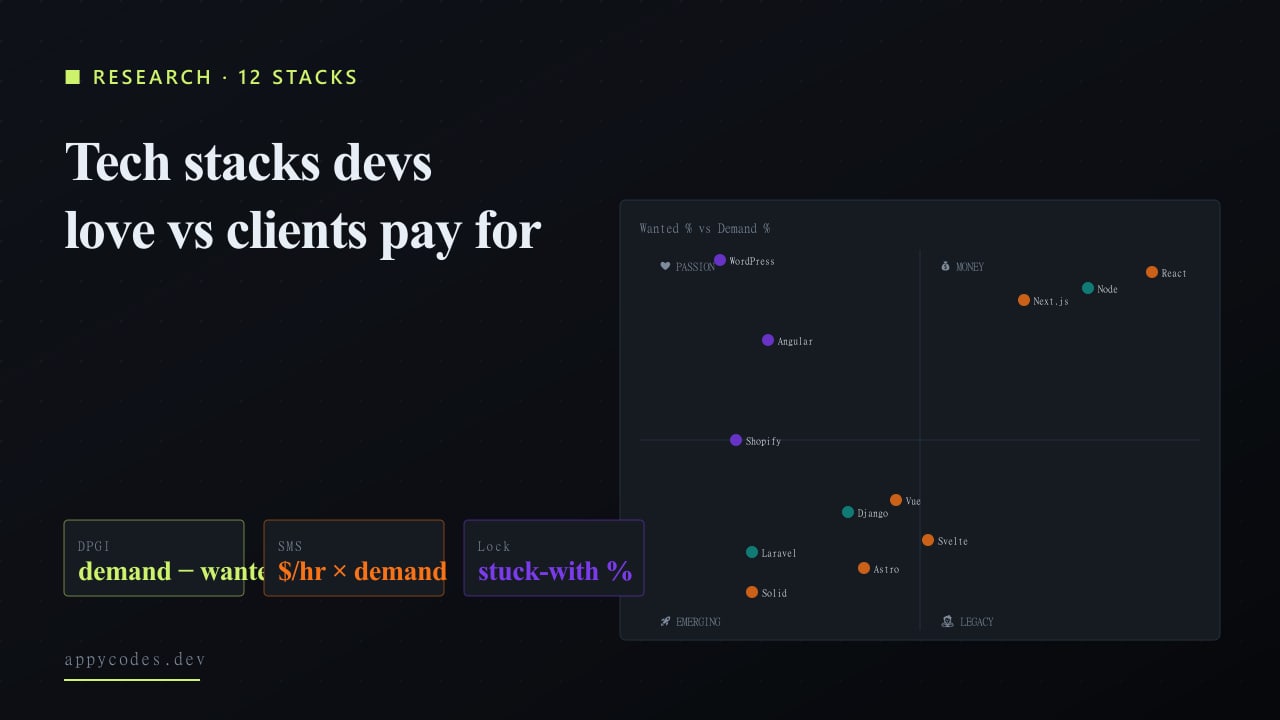
Chart 4, Stack Positioning Map
Same axes as Chart 1, with quadrants. Money (top-right), Passion (top-left), Legacy (bottom-right), Emerging (bottom-left). 'Top-left' here means high preference + low demand. Quadrant split lines at Wanted 15% and Demand 20%.
| Stack | Category | Wanted % (X) | Demand % (Y) | Quadrant |
|---|---|---|---|---|
| React | frontend | 31 | 50 | Money (top-right) |
| Next.js | frontend | 24 | 35 | Money (top-right) |
| Vue | frontend | 16 | 18 | Passion (top-left) |
| Angular | frontend | 8 | 25 | Legacy / forced (bottom-right) |
| Svelte | frontend | 18 | 5 | Passion (top-left) |
| Solid | frontend | 7 | 1 | Emerging (bottom-left) |
| Astro | frontend | 14 | 4 | Emerging (bottom-left) |
| WordPress | cms | 5 | 60 | Legacy / forced (bottom-right) |
| Shopify | cms | 6 | 20 | Legacy / forced (bottom-right) |
| Laravel | backend | 7 | 12 | Emerging (bottom-left) |
| Django | backend | 13 | 14 | Emerging (bottom-left) |
| Node.js | backend | 24 | 50 | Money (top-right) |
Sources: Stack Overflow Developer Survey 2024 to 25; State of JS 2024; W3Techs; blended salary data from Glassdoor + Toptal. Figures rounded.
Reading the Stack Positioning Map
The four quadrants on the map correspond to four real strategic positions for any stack-related career or business decision:
- Money stacks (top-right), high developer preference and high client demand. Both forces pull in the same direction. React, Next.js, and Node.js sit here. Specialising in any of these is a reasonable default; the risk is that the field is crowded.
- Passion stacks (top-left), developers want to use them, clients aren't paying for them at scale. Svelte, Solid, Astro. Excellent for personal projects, side products, or building credibility through public work. Difficult to make the rent on as a primary commercial focus.
- Legacy / forced stacks (bottom-right), clients pay for them; developers do not particularly want to work in them. WordPress and Angular are the canonical examples. Highest income leverage if you can find a way to enjoy the work, because nobody else is competing for the same gigs with the same enthusiasm. Career risk: getting typecast.
- Emerging stacks (bottom-left), neither side has caught up yet. This is the wait-and-see quadrant. Some of these will move up over time; most will stay where they are. Worth tracking as a freelancer or agency lead; rarely worth betting your livelihood on without a clear runway.
Strategic implications
For freelancers
The most defensible career position is in the money quadrant, React, Node.js, Next.js, combined with one specialism on either side. Pair React with Svelte for the side-project credibility and front-end depth signal. Pair Node.js with WordPress for the pure-income hedge. Pure passion-stack specialists are a real and respected category, but the income ceiling caps lower than the discourse suggests. The data on SMS makes that ceiling concrete.
A specific note for early-career freelancers: do not let the conference-talk consensus decide your specialism. Conference talks consistently overweight the top-left quadrant because that's where the interesting engineering content comes from. The work that actually pays follows a different distribution.
For agencies
The most resilient agency portfolios cover both the money and the legacy quadrants. Money stacks (React, Next.js) attract the funded-startup work that looks impressive on a sales deck. Legacy stacks (WordPress especially) provide the steady maintenance and feature retainers that make payroll predictable. Agencies that specialise only in passion stacks have a credibility advantage in a narrow niche; their challenge is winning enough work to scale beyond the founders. We have seen this play out repeatedly with Svelte-only and Astro-only agencies, the website is gorgeous, the pipeline is thin.
A second pattern worth noting: agencies that take a public position against WordPress ("we only build modern apps") are throwing away the highest-DPGI segment of the market. Not every agency should serve that segment, but the decision should be deliberate, not aesthetic.
For startup founders
Pick from the money quadrant unless you have a specific technical reason not to. The depth of the talent pool, both for hiring full-time engineers and for bringing in agencies, is the dominant variable for a small team that needs to ship and iterate. Premium hourly rates in the passion quadrant translate to slower hiring and more bespoke retention work later.
The exception is when the product itself is a developer tool, a content-heavy site that benefits from islands architecture, or a side project where engineering fun is the point. In those cases the passion quadrant is exactly right.
What the demand-vs-preference data really tells you
- Premium hourly rates are mostly a scarcity tax, not a competence premium. Solid's and Svelte's $90 to $100/hr rates exist because qualified specialists are rare, not because the work is intrinsically more valuable than React work at $80/hr. Income totals at the year level favour the deeper market.
- WordPress is the single most underestimated stack in the modern conversation. Roughly 43% of all websites still run on it. The developer-preference data drastically understates the size of the maintenance economy supporting that footprint, and the gap between "developers building with it" and "serious businesses depending on it" is why custom WordPress development for business is one of the highest-leverage commercial specialisations available.
- Angular has the strongest case of pure client inertia in the set. Enterprise demand at 25%, developer preference at 8%. The gap is paid for by very large engineering teams who have neither the time nor the authority to migrate.
- React's wanted-to-used ratio crossing below 1.0 is the most interesting trend in the dataset. Not yet a shift in market share, still a slight bend in the curve. Worth watching for the next two years.
- The hottest framework discussions on Twitter / Hacker News are consistently about stacks under 5% of paid client work. This is neither bad nor good. It just means a major source of inputs into stack decisions is structurally biased toward the passion quadrant. Founders and agency leads should weight discourse accordingly.
Two follow-on reports flesh out specific corners of the quadrant. For founders thinking about modern AI-stack economics, model price tiers, prompt caching, cost-per-MAU by feature class, see our AI feature token economics study. For founders worried about which stack their codebase actually ends up on by Series A, and what that codebase looks like inside, the Series A code audit (23 SaaS codebases) is the companion piece. And for anyone trying to translate stack choice into an MVP budget, what an MVP actually costs in 2026 runs the numbers across 31 funded engagements.
Limitations and how to read this report critically
Three things that should temper any reading of these numbers.
First, the developer surveys cited here oversample English-speaking, start-up-adjacent developers. Real adoption in enterprise IT, in non-English ecosystems, and in the long tail of small-business web work follows different distributions. Angular and Java backends are particularly underrepresented in the surveys versus their actual deployment.
Second, the Demand % synthesis required the most judgement. Job-board frequency is not a clean stand-in for client demand, it overweights staffed-up full-time-employee hiring relative to project-based and agency demand. Where the brief asked for a synthesis we used midpoints, but the numbers in the table should be treated as defensible estimates, not measurements.
Third, hourly rates are heavily skewed by geography. The figures used here are US-leaning blended senior rates. Indian, Eastern European, and South-East Asian rates can be a third to a half of these for equivalent skill. SMS interpretation for non-US freelancers requires re-running the math against the local rate distribution.
The dataset, machine-readable
The full computed dataset is below. We have published this page with a Dataset schema (Schema.org JSON-LD) so search engines and other automated readers can index and cite the figures.
| Stack | DPGI | SMS | HRR | Lock-in |
|---|---|---|---|---|
| React | +19 | 40 | 0.78 | 14 |
| Next.js | +11 | 32 | 1.41 | 3.4 |
| Vue | +2 | 13 | 1 | 5.76 |
| Angular | +17 | 19 | 0.47 | 9.01 |
| Svelte | -13 | 5 | 3 | 1.62 |
| Solid | -6 | 1 | 3.5 | 0.4 |
| Astro | -10 | 3 | 2.33 | 1.32 |
| WordPress | +55 | 30 | 0.29 | 11.56 |
| Shopify | +14 | 14 | 1.2 | 2.5 |
| Laravel | +5 | 7 | 1 | 2.8 |
| Django | +1 | 10 | 1.08 | 4.32 |
| Node.js | +26 | 40 | 0.59 | 13.53 |
How to read this chart for hiring or stack-picking
The single most useful frame to come out of this analysis is the four-quadrant positioning map. Career and agency decisions get made on opinions about where individual stacks sit; this report tries to make where they sit visible. The decision about which quadrant you build a career or a business in is yours. The data above is meant only to make the decision harder to dodge.
If you want this report as a chart pack or want to see the version with your own region's salary multipliers applied, let us know, we'll send the underlying CSV.
Stack choice flows into MVP cost, multi-tenant architecture, and the technical debt that surfaces at Series A, sibling studies on each:
Research
What an MVP Actually Costs in 2026
Three founder stories of 2026 MVP builds, followed by aggregate cost and bandwidth data across 31 engagements.
Research
Series A Code Audit: Inside 23 Funded SaaS Codebases
Patterns from 23 SaaS codebase audits: opens with one anonymised takeover, then aggregates the rubric findings.
Research
We Audited 31 Lovable / Bolt / v0 / Cursor Codebases
A code-level teardown of 31 AI-generated SaaS prototypes: three proprietary metrics and a 10-mode failure taxonomy.
Research
The Multi-Tenant SaaS Architecture Decision
Per-pattern cost, isolation, and onboarding eng-hours for the four common multi-tenancy approaches.
The report covers theory; these are the engagements where we put it into practice. Building on one of these stacks?
Service
SaaS Web App Development
React, Next.js, and Node.js builds: the money-quadrant stack this report keeps pointing back to.
Service
React Native App Development
The mobile surface of the React ecosystem, with the operational costs the hourly-rate column does not capture.
Service
Custom WordPress Development for Business
The highest-DPGI segment in the dataset: the maintenance economy behind 43% of the web.
Frequently asked questions
- Which web tech stacks earn the most freelance money in 2026?
- React and Node.js anchor the top of the Stack Monetization Score chart, high client demand, high hourly rates ($80-100/hr), large freelance markets. WordPress earns less per hour but the volume of work makes it the largest single market overall.
- Why is Angular still in demand if developers don't love it?
- Enterprise codebases. Angular's Developer Wanted percentage runs in the single digits, but enterprise demand keeps it firmly in the 20-25% range of new client work. That demand-vs-preference gap is the structural force behind our DPGI metric.
- Should I learn Svelte or Solid for paid client work?
- Probably not yet. Both have strong developer admiration but the Demand-Preference Gap Index is severely negative, there is more developer enthusiasm than client demand. The $90-100/hr rates exist because the freelance market is tiny, not because every project is well-paid.