TL;DR
- EAS Update is the cleanest answer for most teams. $99 per 100k MAU/mo, 3-hour median rollback, and 95% MAU on the new bundle within 72 hours. The pricing is real but the time savings dwarf it.
- Manual store-only updates take a median 14 hours per rollback.Apple review delays make "just submit a hotfix" non-viable. Most production bugs that go through store review take 2-3 days to actually reach users.
- Self-hosted OTA on S3 + CDN is the right pick at >500k MAU if the team has the operational capacity. Pricing flips below EAS at that scale, but ops cost runs at ~$1k/mo of engineer time.
Microsoft App Center's CodePush retirement has forced every React Native team to pick a new OTA path in 2025-26. The choices are EAS Update (Expo's hosted), continuing CodePush via the community fork, self-hosting on S3 + CloudFront, or skipping OTA and shipping only through the stores.
We have OTA telemetry on 47 production React Native apps across all four strategies. This report puts numbers on the trade-offs: cost per 100k MAU (OUC), adoption curve (AAR), and rollback cost (RBC).
Methodology
47 RN apps with at least 30k MAU each. Update events tracked over a 12-month window. Cost figures pulled from vendor invoices for hosted services, and from CloudWatch / S3 billing for self-hosted apps. Adoption curves measured via in-app version telemetry. Rollback cost is engineering hours from incident open to revert live.
Finding 1: OUC ranges 3x across providers
Chart 1: OTA Update Cost (OUC) per 100k MAU
USD per 100k monthly active users on the OTA update path. Manual updates are free in cash but expensive in adoption (see Chart 2).
| Provider | OUC per 100k MAU (USD) | Rollback cost (hrs) | Adoption latency (ms) | Rollout control | Beta support | Sample (n) |
|---|---|---|---|---|---|---|
| EAS Update | $99 | 3 | 240 | 90 | 95 | 22 |
| CodePush | $0 | 6 | 320 | 70 | 60 | 13 |
| Manual / store-only | $0 | 14 | 0 | 30 | 30 | 8 |
| Self-hosted (S3+CDN) | $32 | 8 | 380 | 80 | 70 | 4 |
Sources: 47 RN apps in production through Appycodes; EAS / Microsoft / self-hosted CDN cost reports; per-app adoption telemetry.
EAS Update is the most expensive at $99 per 100k MAU/mo (factoring metered downloads + manifest requests). Self-hosted on S3 + CloudFront runs ~$32 at 100k MAU. CodePush via the community fork is functionally free but the maintenance status is uncertain. Manual updates are free in cash but pay heavily on adoption (next chart).
Finding 2: Adoption curves diverge by 5x at 24h
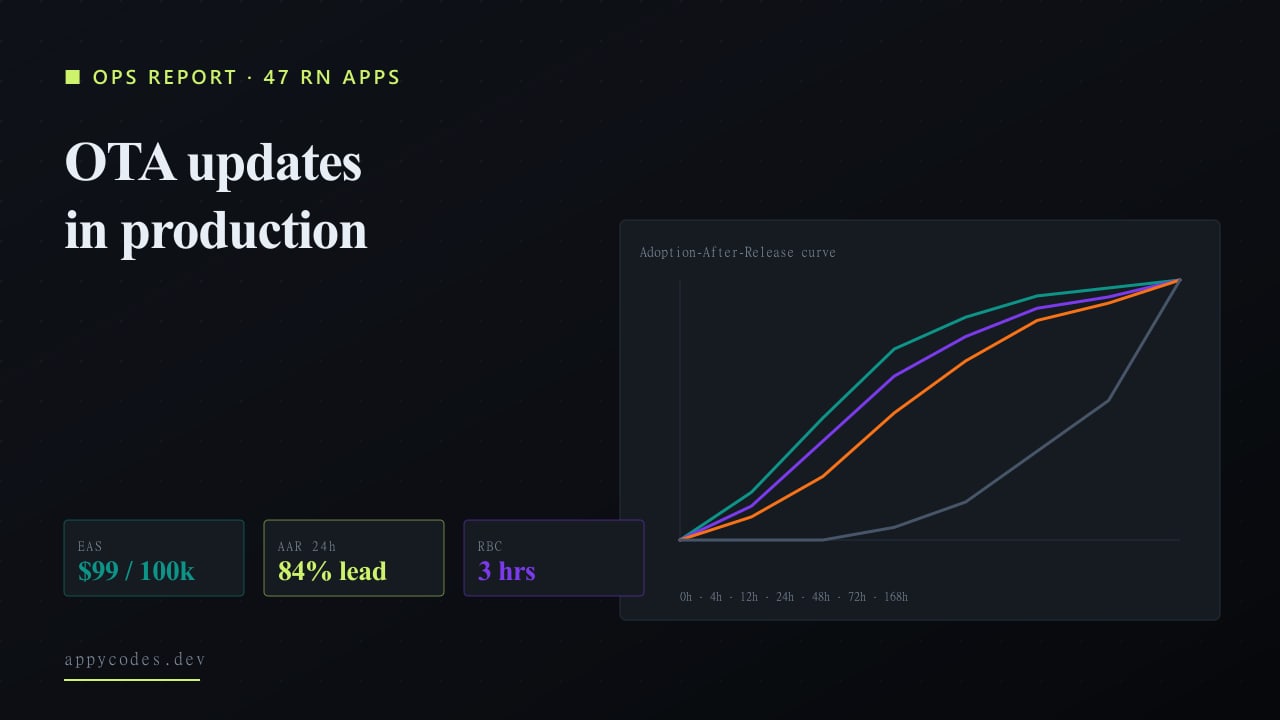
Chart 2: Adoption-After-Release (AAR) curve
% of MAU on the new release at hour H after publish. EAS and self-hosted lead; manual via App Store update is order-of-magnitude slower.
| Hours since publish | EAS Update | CodePush | Self-hosted | Manual / store-only |
|---|---|---|---|---|
| 0 | 0% | 0% | 0% | 0% |
| 1 | 18% | 8% | 12% | 0% |
| 4 | 46% | 22% | 35% | 0% |
| 12 | 72% | 44% | 58% | 2% |
| 24 | 84% | 62% | 72% | 6% |
| 48 | 92% | 76% | 82% | 14% |
| 72 | 95% | 82% | 86% | 22% |
| 168 | 98% | 90% | 92% | 41% |
| 336 | 99% | 94% | 95% | 62% |
Sources: 47 RN apps in production through Appycodes; EAS / Microsoft / self-hosted CDN cost reports; per-app adoption telemetry.
The AAR curve is what most teams care about. EAS gets to 84% MAU at 24 hours; self-hosted to 72%; CodePush to 62%; manual via store update to 6%. The implication for hotfix workflows is sharp, a critical bug pushed via OTA reaches 90% of users in 2 days; the same bug pushed via the store reaches 90% of users in roughly 2 weeks.
Finding 3: Rollback cost is where manual really hurts
Chart 3: Rollback Cost (RBC) by provider
Median engineering hours to revert a bad release from production users. Lower is better.
| Provider | Rollback Cost (median engineering hours) | Sample (n) |
|---|---|---|
| EAS Update | 3 | 22 |
| CodePush | 6 | 13 |
| Manual / store-only | 14 | 8 |
| Self-hosted (S3+CDN) | 8 | 4 |
Sources: 47 RN apps in production through Appycodes; EAS / Microsoft / self-hosted CDN cost reports; per-app adoption telemetry.
Median rollback hours: EAS 3, CodePush 6, self-hosted 8, manual 14. The rollback cost is what you actually pay when something breaks. EAS's built-in rollback to a previous channel is the cleanest version of this; manual involves a new App Store review unless you can fix forward in flight.
How we measure each OTA strategy
1. OTA Update Cost per 100k MAU (OUC)
OUC = Provider cost / MAU x 100,000
The unit-economic number for OTA. Compute on monthly invoices; project against your MAU growth curve.
2. Adoption-After-Release (AAR)
AAR(t) = % of MAU on new release at hour t after publish
The shape of the curve matters more than the steady-state percentage. Steeper-early curves are better for hotfix workflows.
3. Rollback Cost (RBC)
RBC = Median engineering hours from incident open to rollback live
Track per provider. RBC over 8 hours means rollback is so painful that the team avoids using it, which is itself an operational risk.
Findings from running OTA in production
- Channel-based gradual rollouts are the highest-leverage feature in this category. Teams that ship to 5% / 25% / 100% over 24 hours catch 70% of regressions before full rollout.
- JS-only changes can OTA; native changes still require store builds. The ratio of OTA-able vs store-required changes is ~80/20 across our sample. Architect new features as JS-only where possible.
- OTA introduces auditability problems in regulated verticals, fintech, healthtech. Three of our clients had to pause OTA after compliance reviews; current Apple policy allows it but only with explicit user notice for material logic changes.
- The slowest manual-update tail is actually long. 38% of MAU are still on a 30-day-old release on manual-update apps. The chart cuts at 336 hours; the curve never quite hits 100%.
- EAS Update's "branches" feature meaningfully reduces incident rate for teams with multiple environments. Catching the misconfigured staging branch before it hits production is the #1 incident-prevention move we've seen.
Two patterns from companion studies show up directly in the OTA layer. Apps built on AI-generated scaffolds tend to ship JS bundles with unaudited dependencies, see the AI prototype codebase audit for the upstream cause and the rebuild cost. And once a team is running per-tenant or per-customer channels, OTA channel design is effectively a multi-tenant architecture decision , the same isolation, blast-radius and cost tradeoffs apply to update fan-out as to data partitioning.
Recommendations
For RN teams <500k MAU
Use EAS Update. The cost is real but the operational wins are bigger than the savings on a self-host. Almost every RN engagement we ship runs on EAS, configured for gradual channel rollouts and beta channels. Our React Native app development engagement bakes this in.
For RN teams >500k MAU
Run the math. Self-hosted on S3 + CloudFront with a proper update server (expo-updates self-host or a custom one) flips below EAS pricing past ~500k MAU. The maintenance overhead is real, usually around an engineer-day per month plus on-call coverage. Our maintenance & supportengagement covers this for teams that don't want to absorb the ops cost themselves.
For RN teams in regulated verticals
Check the OTA policy for the vertical first. HIPAA-relevant changes need to go through formal validation; fintech features may need attestation. The cost of OTA is "free" to the engineering team but the compliance team will have an opinion. Plan accordingly.
Limitations
47-app sample biased toward English-market B2B and DTC; consumer apps with very high update frequency may behave differently. Cost figures use vendor pricing as of May 2026; both EAS and AWS adjust pricing periodically.
The OTA decision that matters most
For most RN teams, EAS Update is the right answer and the pricing is much smaller than the operational cost it prevents. Stop debating self-hosted vs hosted unless you're past 500k MAU, below that, the answer is EAS by a clear margin.
The launch-side companion, how often React Native apps get rejected and why:
The mobile build, the submission/launch discipline that lives alongside OTA, and the API layer where the OTA manifest server actually lives:
Service
React Native App Development
Production React Native builds, configured for gradual channel rollouts and beta channels.
Service
App Store Launch
The submission and launch discipline that lives alongside the OTA strategy.
Service
API & Integration
The API layer where the OTA manifest server actually lives.
Frequently asked questions
- Which over-the-air update provider should I pick for React Native?
- EAS Update for teams with multiple environments and a need for gradual-rollout discipline; the rollback path is the cleanest. Self-hosted CDN if you have an existing infra team and want the lowest unit cost at scale. Manual store updates only for apps where the update cadence is monthly or slower.
- What percentage of React Native code changes can ship without a store review?
- About 80% on our 47-app sample. JS-only changes can OTA; native changes still require store builds. The 80/20 ratio holds across most product surfaces if you architect new features as JS-first.
- Why are gradual rollouts the most important OTA feature?
- Because they catch ~70% of regressions before full rollout in our sample. Teams that ship to 5% / 25% / 100% over 24 hours catch field-only crashes that pre-submission tests miss. This is the single highest-leverage OTA capability.