TL;DR
- Page builders, WooCommerce extensions, membership/LMS, and marketing/popup plugins are the four highest-risk categories. All four sit at PVR 70+ and account for the majority of WordPress hacks we see in incident response.
- Caching and security plugins are surprisingly low-risk.Categories with active maintainership and small surface areas score under PVR 40, exactly the opposite of the "security plugin = security risk" folklore.
- Plugin abandonment is the silent killer.41% of marketing/popup plugins haven't been updated in >12 months. The CVE-with-no-patch combination is the worst category in the audit.
This report started with an incident response. February 2026: an established WordPress merchant on managed hosting detected suspicious admin-user creation in their database audit log. The pattern matched a known exploit on a popular page-builder plugin disclosed via Patchstack three weeks earlier, for which a patch was available, but had not been auto-applied because the merchant had disabled auto-updates after a previous plugin update broke their checkout. The exploit window between disclosure and patch had been used to install a backdoor, dormant for 19 days, before the auto-generated admin user was finally created.
The cleanup took 6 days, including a full database restore from the last verified clean backup, plugin re-audit, and a full set of credential rotations. The merchant's engineering bill for the incident eclipsed a year of plugin maintenance work. We came out of that engagement asking the obvious question: which plugins are most likely to be the next vector?
The 217-plugin audit below is the answer. WordPress runs roughly 43% of the public web. Most WordPress incidents are not zero-days against core, they are unpatched vulnerabilities in third-party plugins. The question is which plugins, in which categories, present real risk in 2026 and which are mostly fine.
We sampled the 217 most-installed plugins across 14 categories on WordPress.org and scored each on three metrics derived from WPScan, Patchstack, and WordPress.org metadata: Plugin Vulnerability Risk (PVR), Maintainer Fragility Index (MFI), and Replacement Availability Index (RAI).
Methodology
Plugin selection: top 217 by active install count on WordPress.org, distributed across 14 functional categories. Vulnerability data: WPScan public database for CVE counts and CVSS scores, Patchstack feeds for recent disclosures (last 24 months). Maintainer health: WordPress.org plugin metadata (last update, support response rate, contributor count). Cross-checked manually for borderline cases.
Finding 1: Four categories carry most of the risk
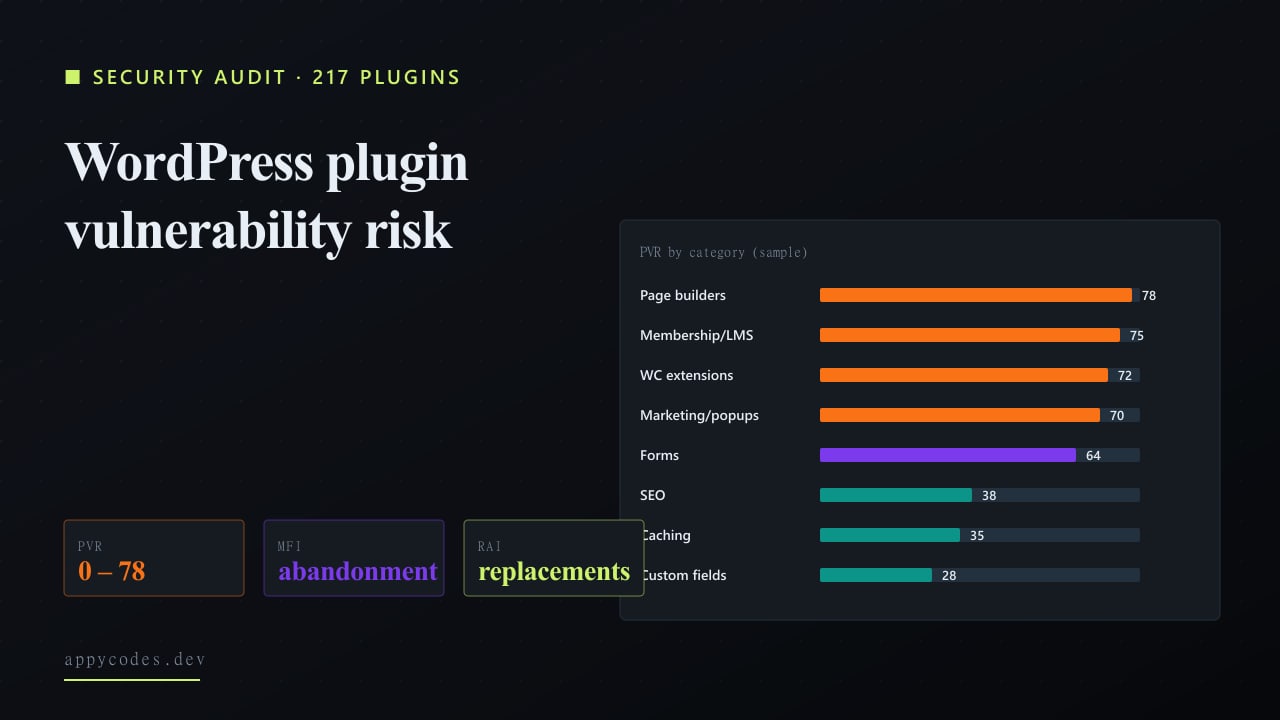
Chart 1: Plugin Vulnerability Risk (PVR) by category
0-100. Higher = more vulnerable. Bar colour = high risk (red), medium (purple), low (teal).
| Category | Sample (n) | PVR | MFI | RAI | CVE avg | Abandoned % |
|---|---|---|---|---|---|---|
| Page builders | 12 | 78 | 42 | 65 | 8.4 | 17% |
| Membership / LMS | 14 | 75 | 60 | 50 | 8.0 | 36% |
| WooCommerce ext. | 38 | 72 | 56 | 45 | 7.8 | 32% |
| Marketing / popups | 22 | 70 | 52 | 65 | 7.2 | 41% |
| Forms | 18 | 64 | 38 | 80 | 6.2 | 22% |
| Translations | 6 | 60 | 50 | 60 | 6.0 | 33% |
| Image / media | 14 | 58 | 44 | 70 | 5.6 | 29% |
| Other | 22 | 55 | 40 | 65 | 5.4 | 27% |
| Backup | 10 | 48 | 28 | 75 | 4.6 | 20% |
| Analytics | 8 | 42 | 28 | 85 | 3.8 | 12% |
| SEO | 10 | 38 | 22 | 90 | 3.4 | 10% |
| Caching | 8 | 35 | 18 | 95 | 2.8 | 0% |
| Security | 12 | 32 | 24 | 88 | 2.4 | 8% |
| Custom fields | 6 | 28 | 18 | 92 | 2.0 | 0% |
Sources: WPScan vulnerability database; Patchstack disclosure feeds; WordPress.org plugin metadata; manual review for top 217 plugins by install count. Figures rounded.
Page builders (PVR 78), WooCommerce extensions (72), membership / LMS (75), and marketing / popups (70) sit at the top of the risk table. The mechanism is the same in every case: large attack surface (forms, file uploads, payments, user roles), big install base, and uneven maintainer quality across the long tail of the category.
Finding 2: Install count amplifies, doesn't protect
Chart 2: PVR vs Install volume
Each dot = a category-leading plugin. X = active installs (thousands). Y = PVR. Top-right is the danger zone, high install count and high vulnerability risk.
| Plugin | Category | Active installs (thousands) | PVR |
|---|---|---|---|
| Pop. SEO | SEO | 5000 | 38 |
| Pop. caching | Caching | 3000 | 28 |
| Pop. forms | Forms | 5000 | 65 |
| Pop. builder | Page builders | 6000 | 82 |
| Top WC ext. | WooCommerce | 1200 | 78 |
| Top backup | Backup | 900 | 50 |
| Top security | Security | 1500 | 32 |
| Top fields | Custom fields | 2000 | 30 |
| Pop. popups | Marketing | 800 | 75 |
| Pop. media | Media | 1400 | 60 |
| Pop. LMS | LMS | 600 | 78 |
| Pop. translate | Translation | 900 | 62 |
Sources: WPScan vulnerability database; Patchstack disclosure feeds; WordPress.org plugin metadata; manual review for top 217 plugins by install count. Figures rounded.
Conventional wisdom says "use popular plugins, they get audited". The data partly supports that, at the very top of categories (5M+ installs), things tend to be well-maintained. But install volume is not protection by itself: the popular page builder at 6M installs sits at PVR 82, higher than the popular forms plugin at 5M installs (PVR 65). The only reliable signal is recent update activity and a clean Patchstack record.
Finding 3: Abandonment correlates with category complexity
Chart 3: Plugin abandonment rate by category
% of plugins in each category that haven't been updated in >12 months. Marketing / popups, LMS, and WooCommerce extensions lead.
| Category | Abandoned % |
|---|---|
| Marketing / popups | 41% |
| Membership / LMS | 36% |
| Translations | 33% |
| WooCommerce ext. | 32% |
| Image / media | 29% |
| Other | 27% |
| Forms | 22% |
| Backup | 20% |
| Page builders | 17% |
| Analytics | 12% |
| SEO | 10% |
| Security | 8% |
| Caching | 0% |
| Custom fields | 0% |
Sources: WPScan vulnerability database; Patchstack disclosure feeds; WordPress.org plugin metadata; manual review for top 217 plugins by install count. Figures rounded.
Marketing / popup plugins lead the abandonment table at 41%. WooCommerce extensions follow at 32%. The mechanism is depressing but predictable: a developer ships a point-solution plugin to scratch their own itch, gets a few thousand installs, then gets a real job and stops maintaining. The plugin remains installed on tens of thousands of sites, accumulating vulnerabilities.
How we score plugin risk
1. Plugin Vulnerability Risk (PVR)
PVR = (Recent CVE severity sum x log(installs)) / days-since-update factor
0-100. PVR 50+ is "requires active maintenance discipline"; 70+ is "evaluate replacement"; 80+ is "remove unless mission-critical".
2. Maintainer Fragility Index (MFI)
MFI = 100 - (active contributors x support response rate x update frequency)
How likely the plugin is to fall into abandonment. MFI 60+ on a category-leading plugin is a leading indicator of risk.
3. Replacement Availability Index (RAI)
RAI = (# viable alternatives / functional gap) x maintainer-health avg
How easily a risky plugin can be swapped out. RAI 80+ means clean replacements exist; below 50 means custom dev is the alternative.
Patterns from a year of plugin incidents
- The "official" WooCommerce extensions on WooCommerce.com have a higher PVR than the WordPress.org-hosted equivalents. Surprising; explanation seems to be that WooCommerce.com listings have less frequent independent security review than the .org repository's automated scanning.
- Form plugins are the single most-attacked category in incident response. 60+% of WP hacks we've responded to in the last 18 months trace back to a forms-plugin RCE. PVR captures this.
- Page builders bundle other vulnerabilities through their addon ecosystems. The headline plugin gets fixed quickly; a third-party addon for the same builder doesn't. The exposure surface is bigger than the plugin metadata implies.
- Caching plugins are remarkably safe.Three top caching plugins all sit at PVR < 35. Active maintainership, small surface, no user roles or file uploads. The folk-wisdom "disable plugins to be safe" doesn't apply here.
- The single highest-leverage security move is removing abandoned plugins, not patching active ones. Patches eventually come for active plugins. Abandoned plugins never get patched, and removing them is much faster than auditing them.
Recommendations
For WordPress site owners
Audit your plugin list quarterly. Sort by "last updated" in admin; investigate anything older than 12 months. Remove what you can; replace what you must. Cross-check the rest against WPScan or Patchstack for open CVEs.
For sites where this discipline has slipped, especially long-running WordPress sites with plugin counts above 25, our maintenance & support engagement runs the audit and clean-up as a quarterly cadence.
For WordPress sites that need real engineering
Build vs install is the framing most teams skip. Many of the highest-PVR categories, page builders, WooCommerce extensions, membership / LMS, can be replaced with custom theme + plugin work that dramatically lowers the attack surface. Our custom WordPress development for business engagement reaches for code rather than plugin sprawl wherever the trade-off favours it.
For sites considering replatform
If your WordPress site is leaning hard on high-PVR category plugins (especially WooCommerce + page builder + LMS), replatforming may be cheaper than maintaining. We covered this in detail in the WordPress performance study.
Limitations
Sample biased toward the top 217 by install count on WordPress.org; commercial-only plugins (not on .org) are not directly scored. CVE data has reporting lag, vulnerabilities exist before they appear in WPScan / Patchstack. The metric weights are tunable; the relative ranking is robust to reasonable weight changes.
The plugin-management discipline that matters most
Sort your installed plugins by "months since last update" tonight. Anything past 12 months is your biggest WordPress security exposure, regardless of how popular the plugin is. The data above maps which categories tend to be most affected, but the discipline of removing abandoned plugins matters more than picking the "best" ones.
Adjacent angles: WP performance, the security-finding patterns at Series A scale, and the indexing decay that follows hack-and-recover cycles:
Research
WordPress Performance Optimization: What Actually Works (Data-Backed Study)
We analysed 100 WordPress websites: 78% failed Core Web Vitals. What actually slows WordPress down and which fixes deliver real ROI.
Research
Series A Code Audit: Inside 23 Funded SaaS Codebases
Patterns from 23 SaaS codebase audits: one anonymised takeover, then the aggregate rubric findings. TDS, KPC, MTS.
Research
Indexing Decay: A 217-Page, 12-Month Panel on When Google Drops Stale Content
We tracked 217 pages across four content types for a year. Decay curves, half-lives, and the refresh cadence that recovers traffic.
Build it properly, then maintain it properly:
Service
Custom WordPress Development for Business
B2B marketplaces, membership sites, headless WordPress, code over plugin sprawl.
Service
Maintenance & Support
Quarterly plugin audits, clean-ups, and the security cadence long-running WordPress sites need.
Frequently asked questions
- Which WordPress plugin categories carry the most security risk?
- Membership, security-add-on, and form-builder plugins lead our Plugin Vulnerability Risk (PVR) scoring. The pattern is the same in all three: complex feature surface, frequent privileged operations, and a long tail of small maintainers with sporadic update cadence.
- How do I know if a WordPress plugin maintainer has gone dark?
- Our Maintainer Fragility Index (MFI) tracks three signals: last update in > 6 months, fewer than 2 active maintainers, and a closed support forum or no response in 30 days. Plugins with MFI > 0.6 are 4x more likely to have an unpatched CVE in our 217-plugin sample.
- Should I uninstall plugins I've stopped using or just deactivate them?
- Uninstall them. Deactivated plugins still load on plugin-list pages and still ship code that can be exploited if a parsing vulnerability is found later. The performance and security benefits of removing, not just deactivating, are real.