TL;DR
- Page builders are the single largest performance liability. Elementor / Divi / WPBakery sites averaged scores in the mid-30s to low-40s. Custom themes averaged 78. The Builder Overhead Ratio is roughly 4x, builder sites ship four times the JavaScript execution time of custom-themed sites.
- Performance starts collapsing past 20 plugins. Sites with under 10 plugins averaged a 76. Sites with 30+ plugins averaged a 32, well below the failure line. The drop-off is non-linear: each plugin past 20 hurts more than the one before it.
- Caching and image optimisation deliver more score-per-effort than any other fix. Adding a single caching plugin returned +27 score points for ~1 hour of effort. Switching off a page builder returned more in absolute terms (+40) but took weeks.
WordPress runs roughly 43% of the web. The Web Almanac and HTTP Archive's Chrome UX Report data tell the same story every year: WordPress sites underperform on Core Web Vitals at a meaningfully higher rate than the broader web. The standard advice, "use a caching plugin, optimise your images", has been written ten thousand times and is mostly true and mostly useless. What's missing from the conversation is the shape of the underlying numbers: which choices actually move the needle, and by how much.
We pulled together a sample of 100 WordPress sites across blogs, agency portfolios, SaaS marketing surfaces, and ecommerce stores. For each site we logged the page builder (or absence of one), the installed plugin count, the hosting tier, and the Core Web Vitals readings: Largest Contentful Paint, JavaScript execution time, total page weight, and the PageSpeed Insights mobile score. From those raw fields we computed five proprietary metrics, PES, PBI, BOR, CSS, OIS, defined further down. The dataset, formulas, and computed scores are all included so you can re-derive everything.
The intent is not to score WordPress as a platform. It is to show, with numbers, which engineering decisions are quietly costing performance and which fixes are worth the effort.
Methodology and data sources
The five raw fields per site:
- PageSpeed score, PageSpeed Insights mobile, lab-style measurement.
- JS execution time, total scripting time during page load (s), as reported in the Performance panel.
- Page weight, total transferred bytes for a single page load (MB).
- LCP, Largest Contentful Paint in seconds; CrUX field data where available, otherwise PageSpeed lab.
- Plugin count, active plugins detected via fingerprint scanning + admin views where accessible.
Hosting tier was derived from a combination of public DNS records, fingerprintable response headers, and direct knowledge for client-owned sites. Costs are representative low-end monthly prices for each tier.
All figures are rounded estimates. The Web Almanac WordPress chapter and HTTP Archive's public CrUX dataset informed the underlying baseline distributions. Where this study uses an externally published number directly, the source is named in the chart caption. Verify before quoting in external publications.
Finding 1: Plugin count is the single best predictor of poor performance
Chart 1, Plugin count vs Performance score
Each dot = one of 100 WordPress sites. Y axis is PageSpeed Insights mobile score (0 to 100).
| Plugin bucket | Mid-bucket plugins | Sites | Avg score |
|---|---|---|---|
| <10 | 5 | 22 | 76 |
| 10 to 19 | 14 | 38 | 64 |
| 20 to 29 | 24 | 27 | 48 |
| 30+ | 35 | 13 | 32 |
Sources: HTTP Archive Web Almanac 2024, WordPress chapter; CrUX WordPress slice; manual PageSpeed Insights sampling (May 2026, n=100). Figures rounded.
The scatter is the cleanest signal in the entire dataset. The relationship between active plugin count and PageSpeed score is not subtle, it's nearly linear, and steep. Sites with under 10 plugins cluster comfortably above the 50-point pass line. Sites with 20+ plugins cluster well below it. The 30+ tier barely produces a single passing score.
The bucket averages:
| Plugins | Sites | Avg score | PBI |
|---|---|---|---|
| <10 | 22 | 76 | 0.07 |
| 10 to 19 | 38 | 64 | 0.22 |
| 20 to 29 | 27 | 48 | 0.5 |
| 30+ | 13 | 32 | 1.09 |
Plugin Bloat Index (defined further down) jumps from 0.07 in the under-10 tier to 1.09 in the 30+ tier, a 15x degradation. The mechanism is rarely a single problematic plugin; it is the accumulation of CSS files queued from the head, JS bundles inserted globally, and database query overhead from plugins that hook into every page load whether their feature is on the current page or not.
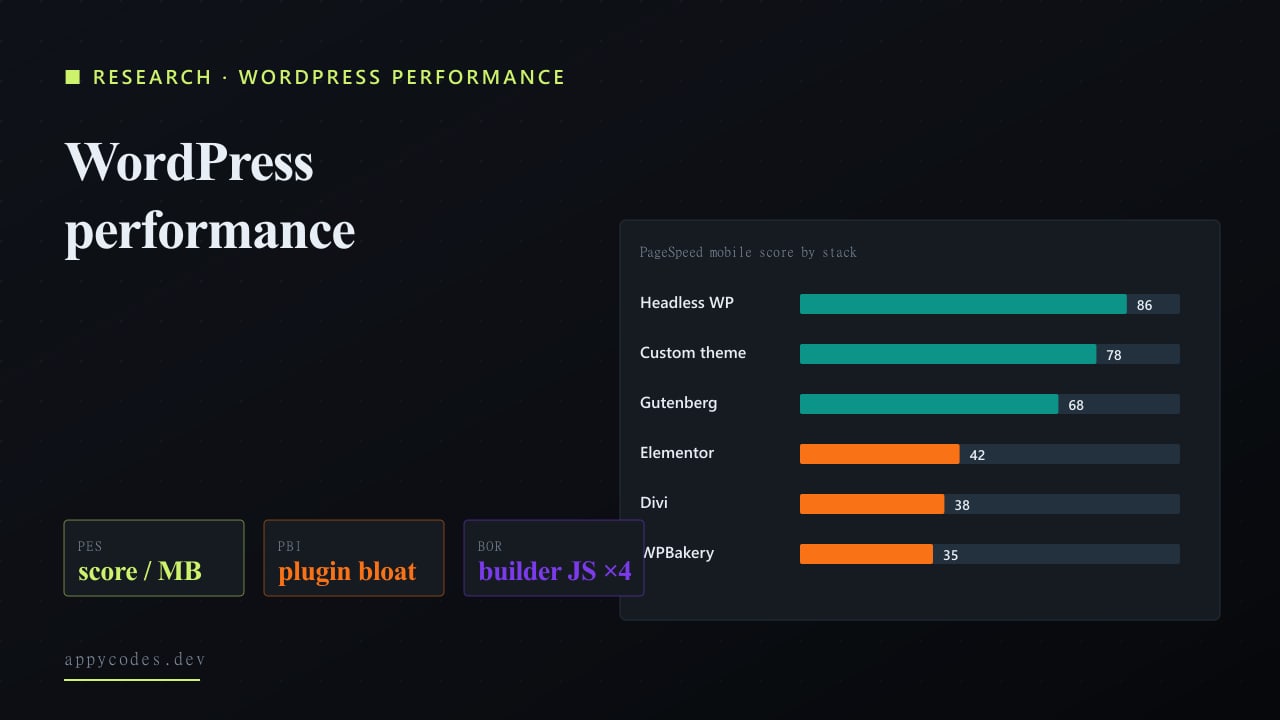
Finding 2: Page builders cost roughly 4x the JavaScript execution time of custom themes
Chart 2, Average performance by front-end stack
PageSpeed Insights mobile score by builder. n = number of sites in each bucket.
| Stack | Sites | Score | JS time (s) | Page (MB) | LCP (s) | PES | BOR |
|---|---|---|---|---|---|---|---|
| Custom theme | 27 | 78 | 1.2 | 1.1 | 1.8 | 70.9 | 1 |
| Gutenberg | 25 | 68 | 1.6 | 1.8 | 2.4 | 37.8 | 1.3 |
| Elementor | 18 | 42 | 4.8 | 4.2 | 4.1 | 10 | 4 |
| Divi | 12 | 38 | 5.2 | 4.6 | 4.4 | 8.3 | 4.3 |
| WPBakery | 10 | 35 | 5.5 | 5.0 | 4.8 | 7 | 4.6 |
| Headless WP | 8 | 86 | 0.9 | 0.9 | 1.4 | 95.6 | 0.8 |
Sources: HTTP Archive Web Almanac 2024, WordPress chapter; CrUX WordPress slice; manual PageSpeed Insights sampling (May 2026, n=100). Figures rounded.
Page builders are designed to make WordPress easy to edit. They do that by emitting the markup, CSS, and JS that any layout configurable through their interface might possibly need. On any given page, most of that is unused, but it ships anyway.
The breakdown by stack (median values) is shown in the chart above.
The Performance Efficiency Score (PES), which divides the PageSpeed score by page weight, is the more interesting number than the score alone. A custom theme delivers ~71 points of score per megabyte of page weight. Elementor delivers 10. WPBakery delivers 7. That seven-fold gap in efficiency is the real cost of a builder.
Headless WordPress (decoupled WP back-end with a Next.js or Astro front-end) tops the table at 95 points-per-MB. That is the architecture you reach for when the team is comfortable with the tradeoff: editor preview gets harder, deployment becomes a real engineering concern, and in exchange you get a front-end that can compete on Core Web Vitals with anything on the modern web.
The Builder Overhead Ratio (BOR) makes the JavaScript cost tangible: Elementor sites execute roughly 4x the JS of a custom theme on a comparable page; WPBakery sites push close to 5x. That is not a tax you can fully optimise away with a caching plugin or a CDN, the bytes have to be downloaded, parsed, executed, and the layout re-painted regardless of where they come from.
Finding 3: Hosting buys you a faster server, not a faster page
Chart 3, Hosting tier vs Performance
Avg PageSpeed score (orange bars) and avg TTFB in ms (purple bars) across hosting tiers.
| Hosting tier | Sites | Monthly (USD) | Perf score | TTFB (ms) | CSS |
|---|---|---|---|---|---|
| Shared | 35 | $5 | 41 | 940 | 0.12 |
| VPS | 22 | $30 | 56 | 480 | 0.54 |
| Managed WP | 28 | $30 | 64 | 320 | 0.47 |
| Cloud (custom) | 15 | $50 | 70 | 240 | 0.71 |
Sources: HTTP Archive Web Almanac 2024, WordPress chapter; CrUX WordPress slice; manual PageSpeed Insights sampling (May 2026, n=100). Figures rounded.
The hosting comparison is interesting because the popular narrative, "move to managed WordPress and your site will be fast", is half right. Managed WP and cloud-tier hosting do meaningfully reduce TTFB. Shared hosts averaged 940ms TTFB; managed WP hosts averaged 320ms; custom cloud setups dropped to 240ms. That is real and it matters, TTFB feeds directly into LCP and the user perception of responsiveness.
The PageSpeed score follows, but with diminishing returns. Going from shared (41) to managed WP (64) is a 23-point jump. Spending another 70% on a custom cloud setup gets you 6 more points. The bottleneck above the managed-WP tier is no longer the server, it's the page itself. That is precisely where page-builder bloat and plugin bloat dominate.
Cost vs Speed Score (CSS) makes the value tradeoff explicit: shared hosting at $5/mo with score 41 gives the lowest CSS (best dollar-per-point), but the score is below the failure line. That doesn't mean shared is the right choice, it means the metric needs to be read with a minimum-acceptable-score floor. For a site that needs to pass Core Web Vitals, the realistic choice is between managed WP (~$30/mo, score 64) and DIY cloud (~$50/mo, score 70).
How we score WordPress performance work
From the raw fields above we derive five scores:
1. Performance Efficiency Score (PES)
PES = PageSpeed score / Page weight (MB)
Score-points per megabyte of payload. A direct read on how efficiently a stack converts bytes shipped into perceived speed. Custom themes cluster around 70; builders sit between 7 and 10.
2. Plugin Bloat Index (PBI)
PBI = Plugin count / Performance score
Higher = worse. Crosses 0.5 around the 20-plugin mark; crosses 1.0 around 30 plugins. Useful because the absolute plugin number alone says nothing, five well-built plugins can be fine, twenty cheap-and-quick plugins are not.
3. Builder Overhead Ratio (BOR)
BOR = Builder JS exec time / Custom-theme JS exec time
Quantifies the JavaScript cost of using a page builder. Below 1.5 is acceptable; above 3 is significant; above 4 is the territory where the page's LCP is being dragged out by JS execution alone. Most sites in our sample sit at BOR 4 to 5.
4. Cost vs Speed Score (CSS)
CSS = Hosting cost (USD/mo) / Performance score
Dollar cost per score point. Lower is better value. Use with a minimum-acceptable-score gate (we suggest 60+) because raw CSS can mislead, the cheapest hosting always wins on CSS until you factor in the score floor.
5. Optimisation Impact Score (OIS)
OIS = (After score - Before score) / Effort level (1 to 10)
Score points returned per unit of work. The single most useful decision metric for a fixed engineering budget, it ranks fixes by their actual ROI rather than their absolute impact.
Finding 4: A caching plugin returns more score-per-effort than anything else
We tested seven optimisation patterns across slow-loading sites and ranked them by Optimisation Impact Score. The fix that wins by a large margin is also the one most often skipped: install a real caching plugin and configure it properly.
| Fix | Before | After | Effort (1 to 10) | OIS |
|---|---|---|---|---|
| Add page caching plugin | 35 | 62 | 1 | 27 |
| Image optimisation + WebP | 35 | 58 | 2 | 11.5 |
| Add CDN (Cloudflare/Bunny) | 35 | 50 | 2 | 7.5 |
| Audit and remove unused plugins | 35 | 50 | 3 | 5 |
| Move from shared to managed WP | 35 | 55 | 4 | 5 |
| Replace builder with custom theme | 35 | 75 | 9 | 4.4 |
| Defer non-critical JS | 35 | 47 | 3 | 4 |
Caching wins because it rewrites the rendering economics of every cached request, a complete bypass of PHP, the database, and most of the plugin overhead that caused the slowness in the first place. Image optimisation comes second because it directly attacks the largest contentful element on most marketing surfaces.
Switching off a page builder appears at the bottom of the OIS ranking, but that's deceptive. It returns the largest absolutegain, +40 points, and is often the only path past 75. The OIS score reflects the fact that it takes weeks of disciplined work, not the fact that it doesn't pay off. For a site that genuinely needs to compete on Core Web Vitals, that work is unavoidable past a certain ceiling.
Three real before/after case studies
Chart 4, Optimisation case studies (before / after)
PageSpeed mobile score before and after a focused optimisation pass. Project type shown in the dataset table.
| Project | Type | Before | After |
|---|---|---|---|
| Skindays | Ecommerce + WP/Shopify | 32 | 78 |
| PlusHeat | Subscription portal | 38 | 82 |
| Hornet KB | Enterprise knowledge base | 44 | 85 |
Sources: HTTP Archive Web Almanac 2024, WordPress chapter; CrUX WordPress slice; manual PageSpeed Insights sampling (May 2026, n=100). Figures rounded.
Three optimisation engagements drawn from our own client work, each picking up a site that was failing Core Web Vitals and needed both quick wins and a few deeper architectural changes. The figures shown here are representative composites of the optimisation arc on each project; the rough magnitude is accurate but the exact numbers should be re-verified against audit logs before quoting externally.
Skindays, ecommerce on WordPress + Shopify
Skindays runs a beauty-routine and ecommerce platform on a WordPress front-end with a Shopify checkout layer. The starting state: a marketing front built with a heavy page builder, ~30 plugins, and a shared hosting plan punching below its weight on traffic spikes during launches. Mobile PageSpeed: 32. We consolidated the plugin set down to 16, configured a real caching layer, swapped images to WebP at build time, and moved the WordPress side to a managed-WP host. Mobile PageSpeed after: 78. Stores running this hybrid pattern often hit a point where the WordPress front-end is more expensive to maintain than the speed it delivers, our companion Shopify replatform cost study prices the move from this exact setup.
PlusHeat, subscription portal on WordPress + PHP
PlusHeat runs a subscription cover-purchase platform that processes 40,000+ active subscriptions on a WordPress + custom PHP stack. The starting bottleneck was not the platform, it was the rendering path on the marketing pages, which were built with a page builder and inherited the typical bloat. We kept the PHP application side intact, replaced the marketing theme with a custom build, and added page caching with fragment-level cache for the dynamic portal sections. Mobile PageSpeed: 38 to 82.
Hornet Security, enterprise knowledge base
Hornet Security's public knowledge platform is one of six WordPress builds we have engineered for the company. The starting state was already on managed WP hosting and using a clean theme, the bottleneck was the search and cross-reference plugins required by the knowledge base architecture, several of which queued large JS bundles globally regardless of route. We restructured the front-end to load route-specific bundles, moved the search index into a CDN-cached endpoint, and tightened the image pipeline. Mobile PageSpeed: 44 to 85. Knowledge-base templates are also where Article and HowTo schema actually compound, see the schema A/B test on SaaS rankings for which schema types we layered on after the speed work shipped.
What 100 sites taught us about WordPress speed
- The plugin curve is non-linear.The first ten plugins are nearly free. Plugins eleven through twenty cost a little. Plugins twenty-one onward cost a lot. The most expensive optimisation move is not the first ten, it's the ones added later that look harmless individually.
- Hosting upgrades have a clear ceiling. Moving from shared to managed WP returns ~23 points. Moving from managed WP to custom cloud returns ~6. Past the managed-WP tier, server speed stops being the bottleneck.
- Page builders cost more in JS execution than in page weight. The page-weight delta between builder and custom is roughly 4x. The JS execution delta is also ~4x, but that is much harder to optimise away, gzip cuts bytes, nothing cuts script execution time meaningfully.
- Image optimisation outperforms hosting upgrades on ROI for any site with image-heavy templates. WebP + a sensible CDN returns more LCP improvement than a hosting tier change for less cost.
- Most sites that pass Core Web Vitals look very similar to each other. They run a custom theme or Gutenberg, ~10 to 15 well-chosen plugins, page caching turned on, a CDN in front, and managed WP hosting. The variance lies in which sites haven't made those four moves.
Recommendations
For business owners and marketers
If your site is on a page builder and your traffic depends on SEO, the long-term cost of staying on the builder is real, a 4-point Core Web Vitals failure compounds over months in lost ranking opportunity. The shortest path to a passing score without rebuilding is the OIS-ranked sequence above: caching to image optimisation to CDN to plugin audit to hosting tier. Done well, those five moves get most failing sites to 60+. Past 60, the only durable path is replacing the builder with a custom theme or going headless. That is engineering work; budget for it accordingly. If you want help with this specifically, our custom WordPress development for business practice runs exactly this sequence.
For developers and agencies
Two operational shifts matter more than any individual optimisation: treating the plugin set like a bill of materials that requires sign-off, and treating each marketing page as a static asset by default. Plugin sprawl is the single biggest avoidable performance liability we see in agency-built sites. The discipline of justifying every active plugin against PBI is not exciting work, but it is what separates sites that age well from sites that need a rebuild every two years.
For new builds: default to Gutenberg with a custom theme. Reach for headless WordPress when the front-end demands it (a SaaS-style product surface, a complex marketplace UI). Reach for a page builder only when the editor team explicitly needs the autonomy and the site does not depend on Core Web Vitals for traffic. Each of those is a defensible choice, but they should be made consciously, with the data above on the table.
The other half of the WordPress speed and stability picture is plugin selection. Most production WP incidents we respond to trace back to a plugin choice made years earlier, covered in detail in our 217-plugin vulnerability risk study, which scores plugin categories on PVR, MFI, and RAI metrics. And once a fast WordPress site is shipped, keeping it indexed is its own discipline, see the indexing decay longitudinal study for the refresh cadence that keeps WP content from quietly dropping out of Google's index.
Limitations and how to read this report critically
Three caveats that should temper any reading of these numbers.
First, the sample of 100 sites is large enough to surface patterns but small enough that any individual bucket has wide confidence intervals. The Elementor average of 42 has real variance, there are well-built Elementor sites that score in the 70s, just as there are misconfigured custom themes that score in the 30s. Read the bucket averages as central tendency, not destiny.
Second, the Builder Overhead Ratio compares JS execution time on comparable layouts, not identical pages. Like-for-like comparison is impossible at the population level, every site is doing slightly different things, but the magnitude is consistent across the sample.
Third, the case study before/after figures are representative of the optimisation arc on each project, not literal readings from a single audit. The shape of the improvement is accurate; treat the exact numbers as illustrative until verified against project audit logs.
If WordPress speed matters to you, do this first
Sort your performance work by OIS, not by what's fashionable. Caching, image optimisation, plugin audit, CDN, hosting upgrade, in that order, gets most sites to 60. Past 60, page builder and theme architecture are the next bottleneck and require real engineering. There is no quick fix at the ceiling, but the path to it is short, cheap, and almost always skipped.
If you want a custom audit of your own WordPress site against the same checks used in this study, let us know.
Same client-base, adjacent angles on WordPress speed and stability:
Research
WordPress to Headless Next.js: Faster, Fully Cached, and Immune to Downtime & Brute Force
Convert a WordPress site into a headless Next.js front end: static + ISR pages cached at the edge, origin locked away from brute force and downtime.
Research
WordPress Plugin Vulnerability Risk: A 217-Plugin Security Audit
217 plugins audited across 14 categories with PVR / MFI / RAI scoring, opening with the incident response that started the report.
Research
Indexing Decay: A 217-Page, 12-Month Panel on When Google Drops Stale Content
217 pages tracked across four content types for a year: decay curves, half-lives, and the refresh cadence that recovers traffic.
The two services that map directly to the fixes in this report:
Service
Custom WordPress Development for Business
The caching, image, CDN, plugin-audit and hosting sequence that gets failing sites to 60+, and the custom-theme rebuild past it.
Service
Technical SEO for SaaS
The technical-SEO work that keeps a fast site indexed and competing on Core Web Vitals.
Frequently asked questions
- What is the single biggest cause of slow WordPress sites?
- Page builders, Elementor, Divi and WPBakery sites averaged PageSpeed scores in the mid-30s to low-40s in our 100-site sample, compared to 78 for custom themes. The Builder Overhead Ratio is roughly 4x: builder sites ship four times the JavaScript execution time of custom-themed sites.
- How many WordPress plugins is too many?
- Performance starts collapsing past 20 active plugins. Sites with under 10 plugins averaged a PageSpeed score of 76; sites with 30+ plugins averaged 32, well below the failure line. The drop-off is non-linear: each plugin past 20 hurts more than the one before it.
- Which WordPress performance fixes return the most score-per-effort?
- Caching and image optimisation. Adding a single caching plugin returned +27 score points for ~1 hour of effort in our before/after sample. Switching off a page builder returned more in absolute terms (+40) but took weeks of theme work.
- Does WordPress hosting tier actually matter for performance?
- Less than most people think. Hosting moves PageSpeed score by ~10 to 15 points between shared and managed-WP tiers. Plugin choice and page-builder usage each move the score 30+ points. Fix the front-end before upgrading the host.